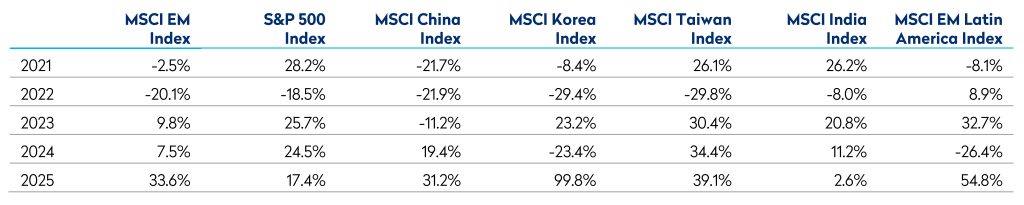

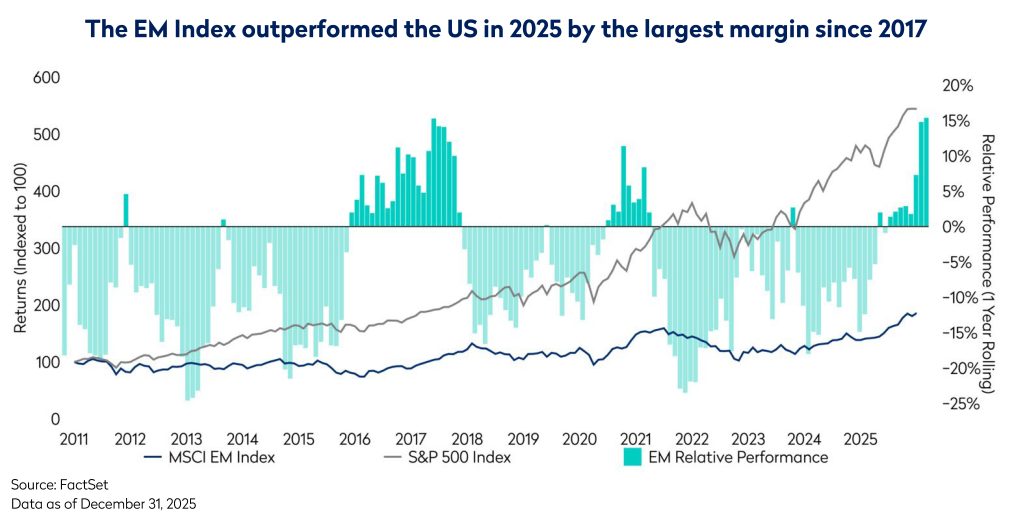
It has been rare to be able to write about the outperformance of Emerging Markets (EM) over the past 15 years, especially when comparing to the remarkable gains made by US indices over the same period. Nevertheless, the EM asset class has confounded the sceptics to record a gain of 34%, outperforming the S&P 500 by 15% and making 2025 one of the best years for EM relative performance since 2010. This outcome likely surprised many given the narrative of US exceptionalism and AI skepticism that dominated as we entered 2025, and the tariff-related shocks unleashed during the year. In the event, the EM recovery has been propelled by a combination of secular and cyclical earnings growth drivers. Additionally, fund data showed a rotation towards EM exposure, with investors attracted further by the persistent EM valuation discount. Whether this marks the beginning of a more sustained period of positive EM returns remains to be seen, but we find several encouraging trends and themes underlying 2025’s strong performance dynamics.
First, the recovery in EM’s largest equity market, China, accelerated with the market gaining a further +31%, as policy support and clearer industrial priorities, such as the anti-involution agenda, restored confidence in cyclical and technology sectors, from exceptionally low starting valuations. The launch of the DeepSeek LLM in Q1 further boosted sentiment, with the AI model emerging as a credible rival to US systems. Innovative architecture and open-source accessibility drove rapid user adoption while the design and delivery by a Chinese company of a competitive LLM offering, despite significant restrictions over the import of critical technologies, signaled that Chinese innovation and entrepreneurial strength remained highly relevant factors in the global AI race. This supported Chinese technology related stocks and, for a period, contributed to a pullback in some US tech names. Outside the tech sector, China’s economy still faces substantial challenges, including unresolved issues in real estate, elevated local-government debt, and a cautious consumer. Nonetheless, valuations remain reasonably attractive, and policy appears to be slowly nudging the economy toward a healthier medium-term footing.
Second, EM Asia’s comparative advantage in semiconductor manufacturing drove exceptional returns in Korea +100% and Taiwan +39%. In the latter, TSMC, and hardware providers such as Delta and Hon Hai continued to flourish, while Korean memory-chip manufacturers SK Hynix and Samsung Electronics were standout beneficiaries of the accelerating AI capex cycle. Korea was the strongest performing equity market globally, also helped by the new government’s commitment to the Value-Up program. A sustained improvement in corporate governance, shareholder returns, and ROE should provide a solid foundation for further long-term rerating. The key question for Korea and Taiwan looking forward is over the sustainability of AI led semiconductor demand. Few doubt AI’s transformative impact, however not all companies can be winners, and three years on from the launch of ChatGPT, evidence of AI projects delivering an acceptable return on capital for end customers remains elusive. We believe however that such concerns raise greater questions for the prospects of capex spenders in the West, while within Taiwan and Korea most companies are effectively “picks and shovels” plays, offering in our view a safer route to benefiting from the proverbial gold rush. We have reduced exposure to these markets following the sharp price rises, but remain constructive on the long-term prospects for this area of clear comparative advantage for EM, alongside valuations that typically remain lower than their US counterparts.
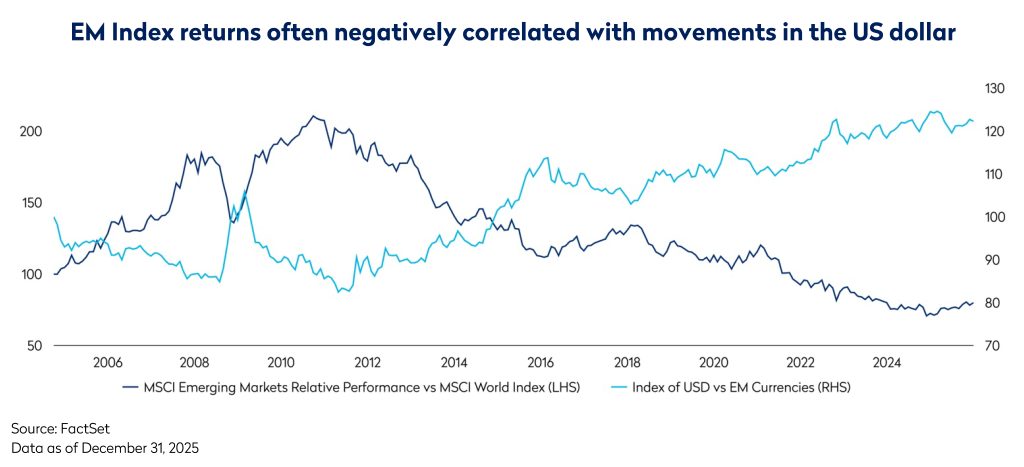
Third, and not to be underestimated, is the impact of US dollar weakness. Beyond the mechanical effect of boosted USD denominated returns, a softer dollar typically supports EM equities further through easing financial conditions, and greater risk appetite. Some EM governments and corporates borrow in dollars, so a weaker dollar reduces their debt-servicing burden and frees up domestic resources for investment and growth. At the same time, dollar weakness often coincides with expectations of lower US interest rates, prompting global investors to seek higher returns abroad. Finally, commodities, vital for many EM exporters, tend to strengthen when the dollar falls, boosting earnings and equity valuations. Latin America, which lacks significant listed AI exposure, was the biggest beneficiary of this dynamic, with the region returning 55% in 2025. Given President Trump’s vocal advocacy for deeper interest rate cuts, and the likelihood that he appoints a politically aligned Fed Chair in May, further US dollar weakness in 2026 appears realistic, which should continue to support EM performance.
Despite the asset class returning 34%, performance was far from uniform, with geopolitics and local fundamentals shaping dispersion. India +3% delivered its weakest relative performance in over two decades, reflecting high starting valuations, a cyclical slowdown, and a 5% depreciation of the rupee against the US dollar. The imposition of elevated Trump tariffs toward year-end added to the pressure. Elsewhere, Southeast Asia lagged amidst a mix of political uncertainties and subdued economic outcomes. India remains a challenge for value-oriented investors such as Mondrian (as we set out in detail last quarter) although we did narrow our underweight. We more meaningfully increased exposure through the year to Indonesia, Thailand and the Philippines, where valuations became particularly compelling following underperformance.
Entering 2026, we continue to hold a constructive view on many of the key enabling factors that have driven strong returns during 2025. With AI capex projected to grow again and the value-up initiative in Korea ongoing, Taiwan and Korea could see ongoing support. Meanwhile, a more robust Chinese economic recovery that converts policy stimulus into genuine and broad-based profit growth would be an important driver given China’s benchmark weight and its central role in regional supply chains. Despite having re-rated during the year, most Emerging Markets continue to trade at a discount to developed markets, and particularly to the US. Combined with expectations of accommodative US monetary policy, this should support investment flows to EM markets and currencies provided there are no significant external shocks or arising issues that erode these strengths. With many such positive factors in play across the larger EMs, another good year is possible.
However, these same factors also carry clear downside risks. Aside from a downward shift in expectations for AI capex; a sharper than expected slowdown in commodity intensive demand or a renewed decline in commodity prices would challenge key exporters in Latin America and South Africa that benefitted from 2025’s strength. Geopolitical flare-ups or a loss of confidence in China’s policy execution could also reverse the positive momentum, while EM currencies remain vulnerable to changes in US real rates and shifts in global risk sentiment. Absent these risks though, the current set-up has the potential to be supportive for emerging markets in 2026.
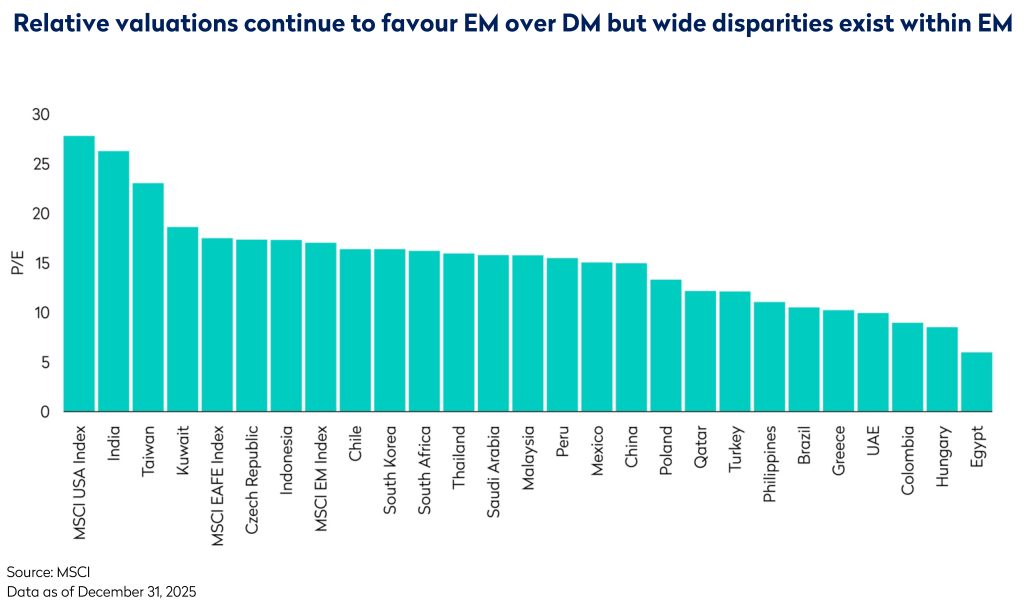
Mondrian has therefore adopted a selectively optimistic stance. Throughout 2025 we consistently took profits from winners, reallocating toward opportunities offering superior risk adjusted returns and ensuring that the portfolio remained underpinned by clear valuation upside. Reductions centered on some of the year’s strongest performers – AI related names in China, Korea and Taiwan; as well as gold and materials. We rotated into certain lower beta Chinese companies with strong balance sheets and reliable dividend paying capacity, as well as undervalued laggards in the Middle East, Southeast Asia and select Indian opportunities. We end the year with the portfolio still offering attractive value metrics on a PE of c.13x and a Dividend Yield of c.4%. This should position the portfolio to capture the secular growth opportunities across a broad range of Emerging Markets in addition to benefiting from cyclical normalization, while remaining watchful for opportunities created by market volatility.
Disclosures
Views expressed were current as of the date indicated, are subject to change, and may not reflect current views. All information is subject to change without notice. Views should not be considered a recommendation to buy, hold or sell any investment and should not be relied on as research or advice.
This document may include forward-looking statements. All statements other than statements of historical facts are forward-looking statements (including words such as “believe,” “estimate,” “anticipate,” “may,” “will,” “should,” “expect”). Although we believe that the expectations reflected in such forward-looking statements are reasonable, we can give no assurance that such expectations will prove to be correct. Various factors could cause actual results to differ materially from those reflected in such forward-looking statements.
Neither MSCI nor any other party involved in or related to compiling, computing or creating the MSCI data makes any express or implied warranties or representations with respect to such data (or the results to be obtained by the use thereof), and all such parties hereby expressly disclaim all warranties of originality, accuracy, completeness, merchantability or fitness for a particular purpose with respect to any of such data. Without limiting any of the foregoing, in no event shall MSCI, any of its affiliates or any third party involved in or related to compiling, computing, or creating the data have any liability for any direct, indirect, special, punitive, consequential or any other damages (including lost profits) even if notified of the possibility of such damages. No further distribution or dissemination of the MSCI data is permitted without MSCI’s express written consent.
This material is for informational purposes only and is not an offer or solicitation with respect to any securities. Any offer of securities can only be made by written offering materials. The information set forth herein is a summary only and does not set forth all of the risks associated with the investment strategy described herein.
The information was obtained from sources we believe to be reliable, but its accuracy is not guaranteed, and it may be incomplete or condensed.
Characteristics such as P/E and dividend yield are not reliable indicators of future results and are subject to change.
Calculations for characteristics are based on generally accepted industry standards. All characteristic data is produced using Mondrian’s accounting system data. It should not be assumed that investments made in the future will be profitable or will equal the performance of any security referenced in this document. Examples of securities will represent only a small part of the overall portfolio and are used to illustrate our investment approach. Any holdings are subject to change and may not feature in any future portfolio. More information on holdings is available on request.
Unless otherwise stated, all returns are in USD.
All references to index returns assume the reinvestment of dividends after the deduction of withholding tax and approximate the minimum possible re-investment, unless the index is specifically described as a “Gross” index
Past performance is not a guarantee of future results. An investment involves the risk of loss. The investment return and value of investments will fluctuate.
Mondrian Investment Partners Limited is authorised and regulated by the Financial Conduct Authority (Firm Reference Number: 149507). Mondrian Investment Partners Limited is also registered as an Investment Adviser with the Securities and Exchange Commission (registration does not imply any level of skills or training).