

| • | Greater index concentration, particularly in the US and growth style indices has created portfolio construction challenges for some |
| • | Whilst concentration has been driven by growth and momentum, this outperformance has been created by a relatively narrow list of names |
| • | These names are highly correlated and amplify risk in portfolio construction particularly for those who are benchmark aware |
| • | Diversifying the asset class into Global AC World or EAFE, particularly in the value space mitigates these risks and maintains alpha generating opportunities |
Why Value in a Concentrated World?
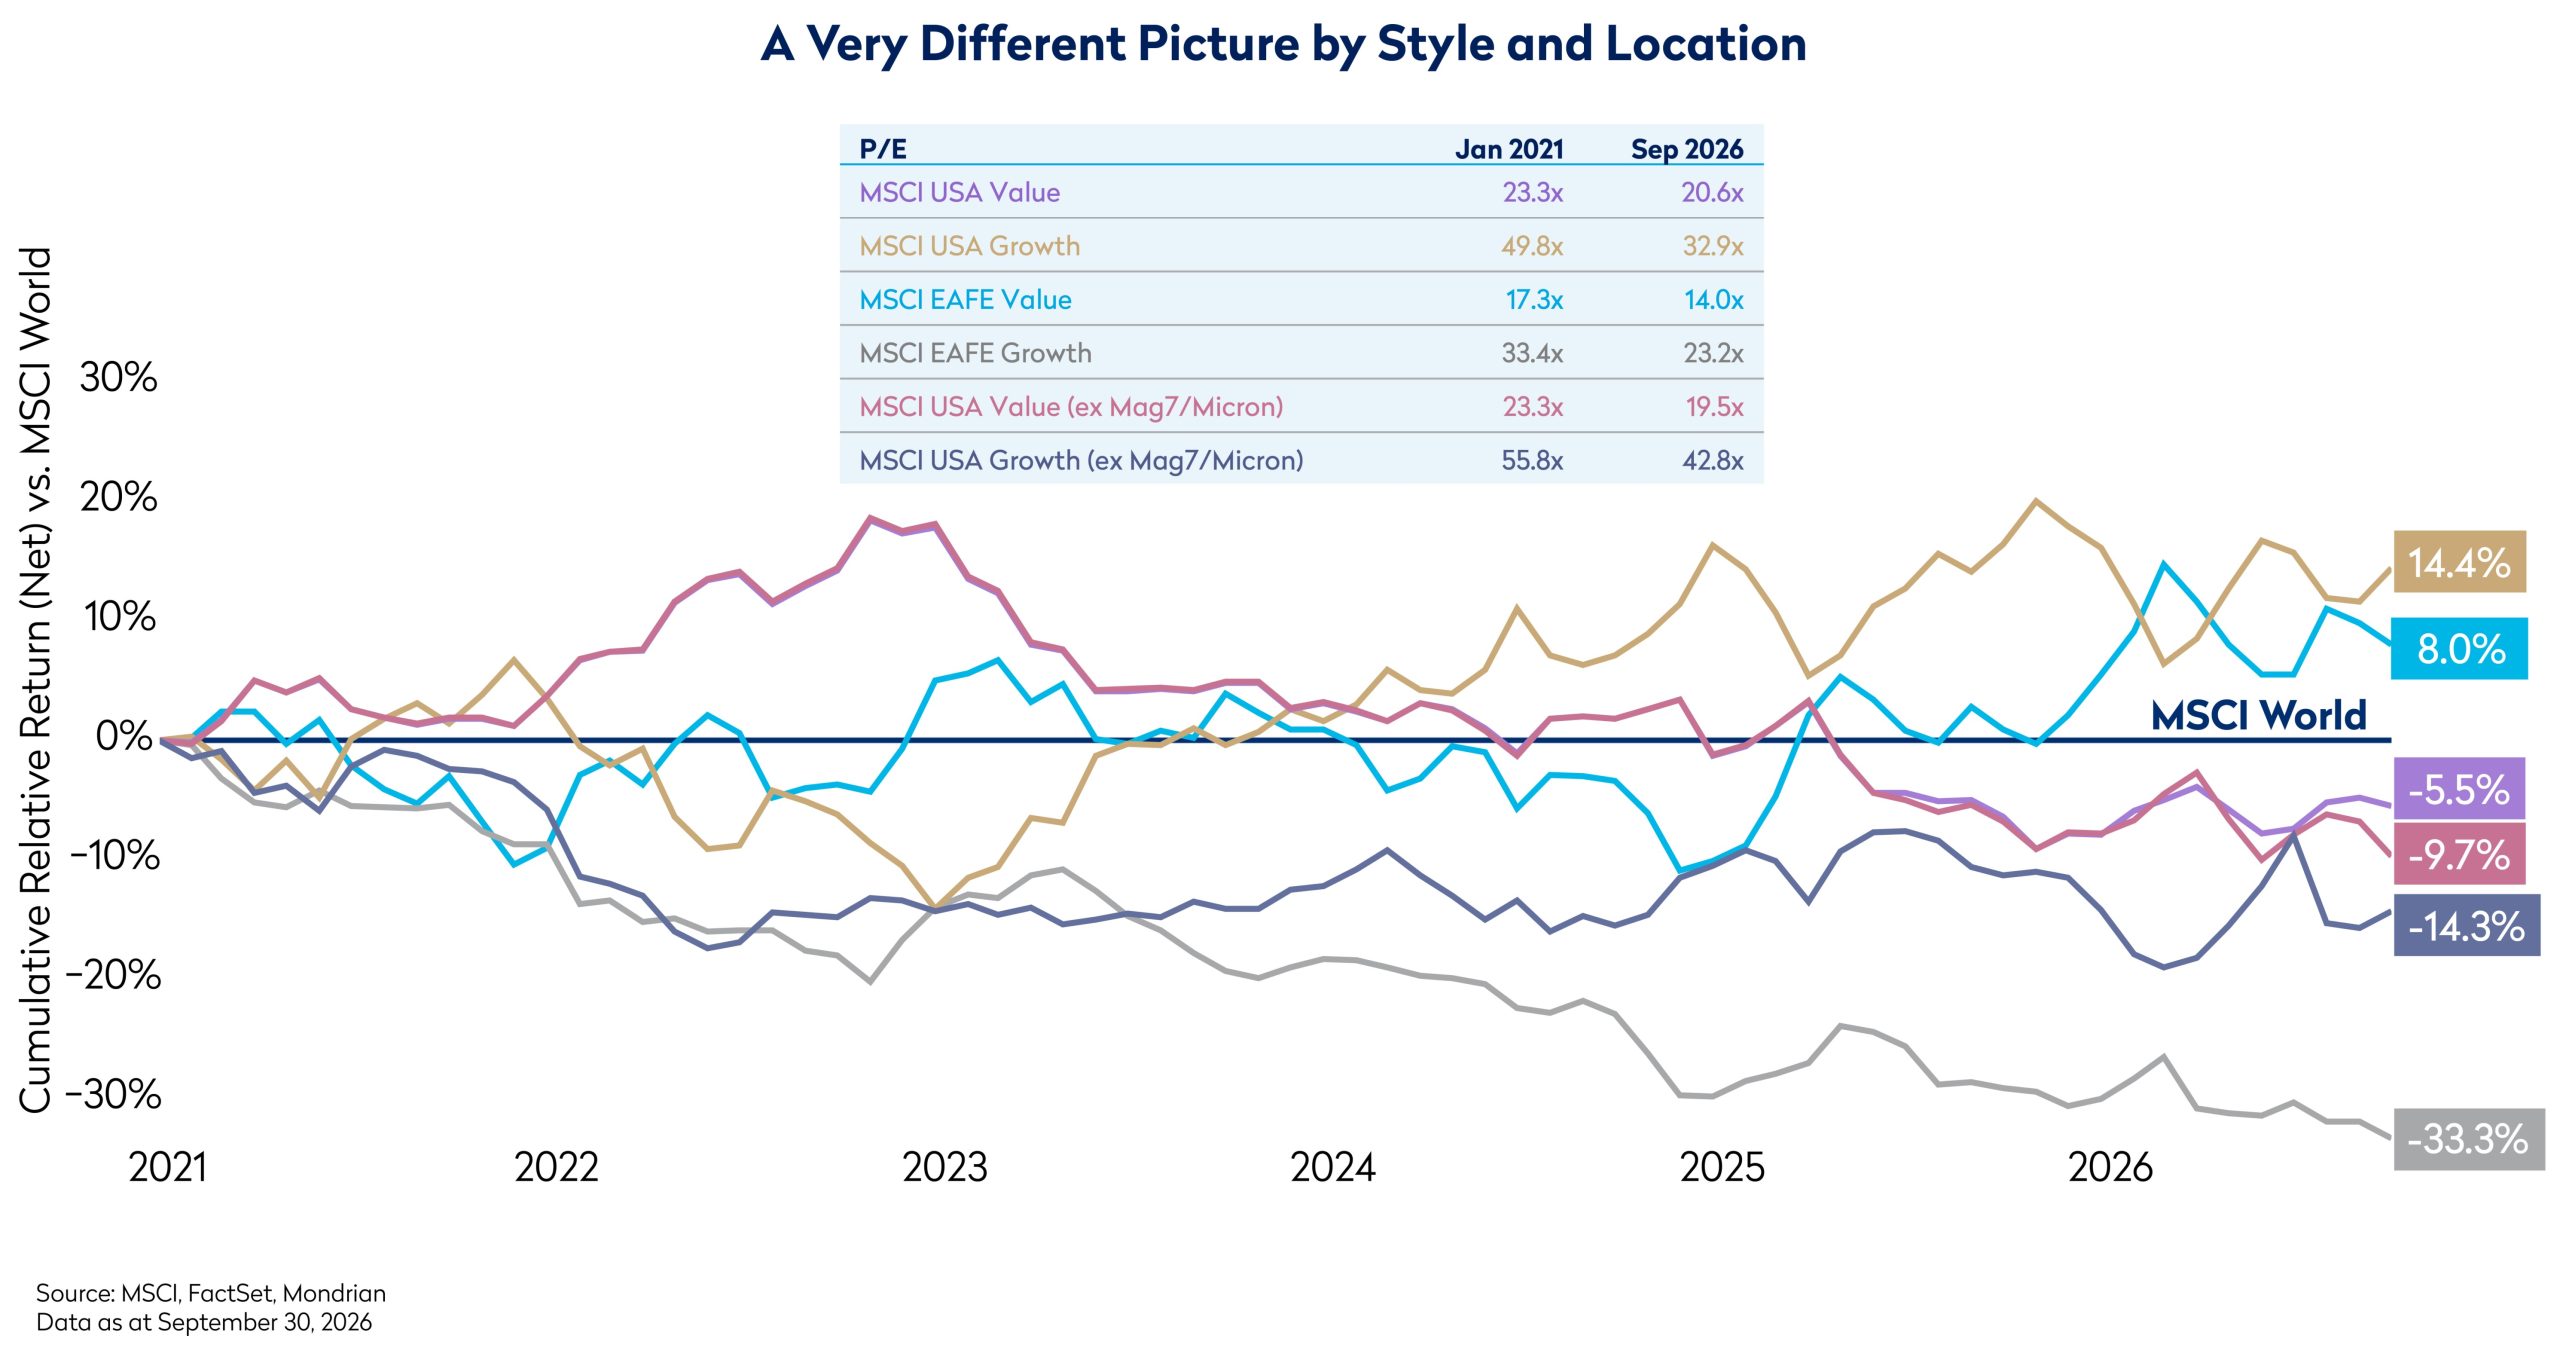
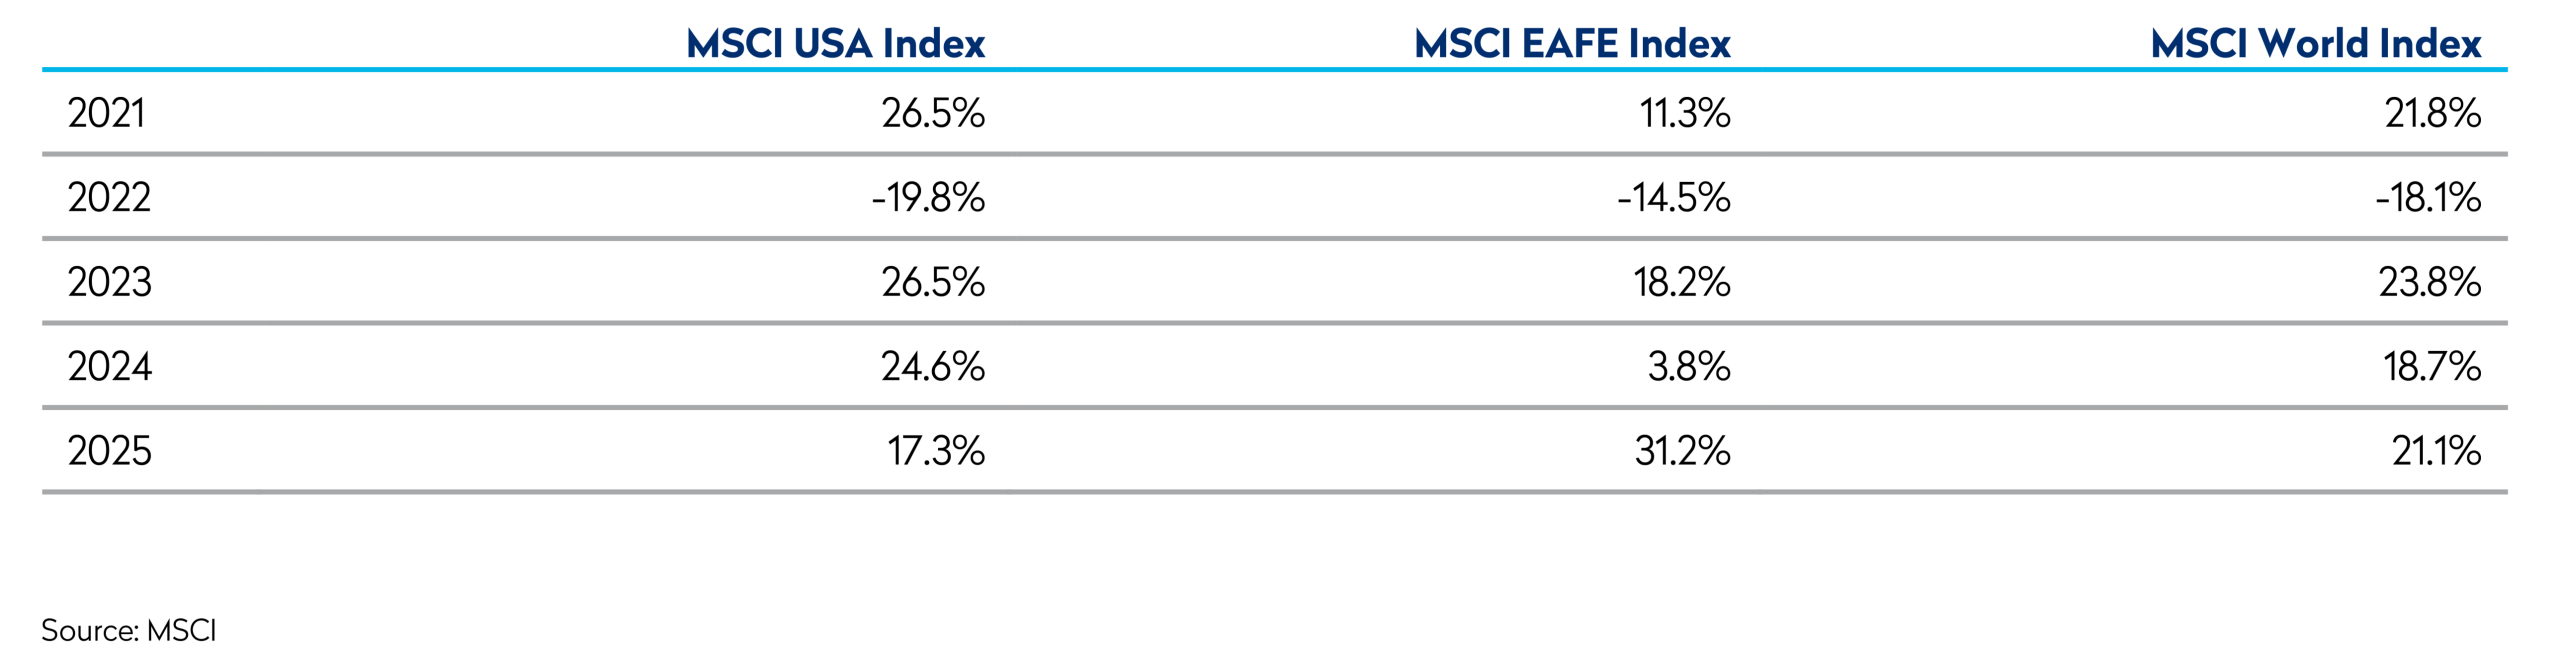
The period since the Global Financial Crisis is often described as a simple story: growth has won and value has been left behind. That description is directionally true at a global level, but it masks a much more nuanced story when we look beyond the US. In the last 10 years, growth style’s dominance has been heavily influenced by a relatively small group of US companies and more recently supported by enthusiasm surrounding AI. Across developed non-US markets however, value has materially outperformed growth since 2022, as the chart below illustrates.
This distinction matters because the extreme concentration associated with certain growth benchmarks is not a universal feature of equity markets. More diversified investment universes, particularly developed markets outside the US, and value benchmarks generally exhibit a broader distribution of stocks and risk. These differences highlight why the concentration and risk challenges facing growth benchmarks should be considered separately from those of more diversified markets and value strategies.
For long-term investors, the question is not simply whether value or growth will lead next, but whether holdings reflect an independent assessment of prospective returns or primarily the increasing index weights of past winners. Against this backdrop, valuation discipline, benchmark-aware active judgement and genuine diversification take on renewed importance.
Reassessing Growth’s Global Dominance
From the GFC through the years of exceptionally low interest rates, long-duration growth assets benefited from falling discount rates and the emergence of a powerful group of technology winners. More recently, inflation and real interest rates have risen, yet growth leadership has persisted in parts of the market. Rather than a broad-based triumph of growth investing, this increasingly reflects the exceptional performance of a narrow set of companies, particularly those associated with AI and the technology investment cycle.
The chart on the preceding page demonstrates the geographic and style divergence. From 2021 to September 2026, MSCI EAFE Value returned 8.0% cumulatively relative to MSCI World, while MSCI EAFE Growth lagged it by 33.3%; MSCI USA Growth was 14.4% ahead. The global headline therefore obscures how different the experience has been for diversified non-US value investors. What appears at a global level to be a story about investment style is therefore also a story about geographical jurisdiction.
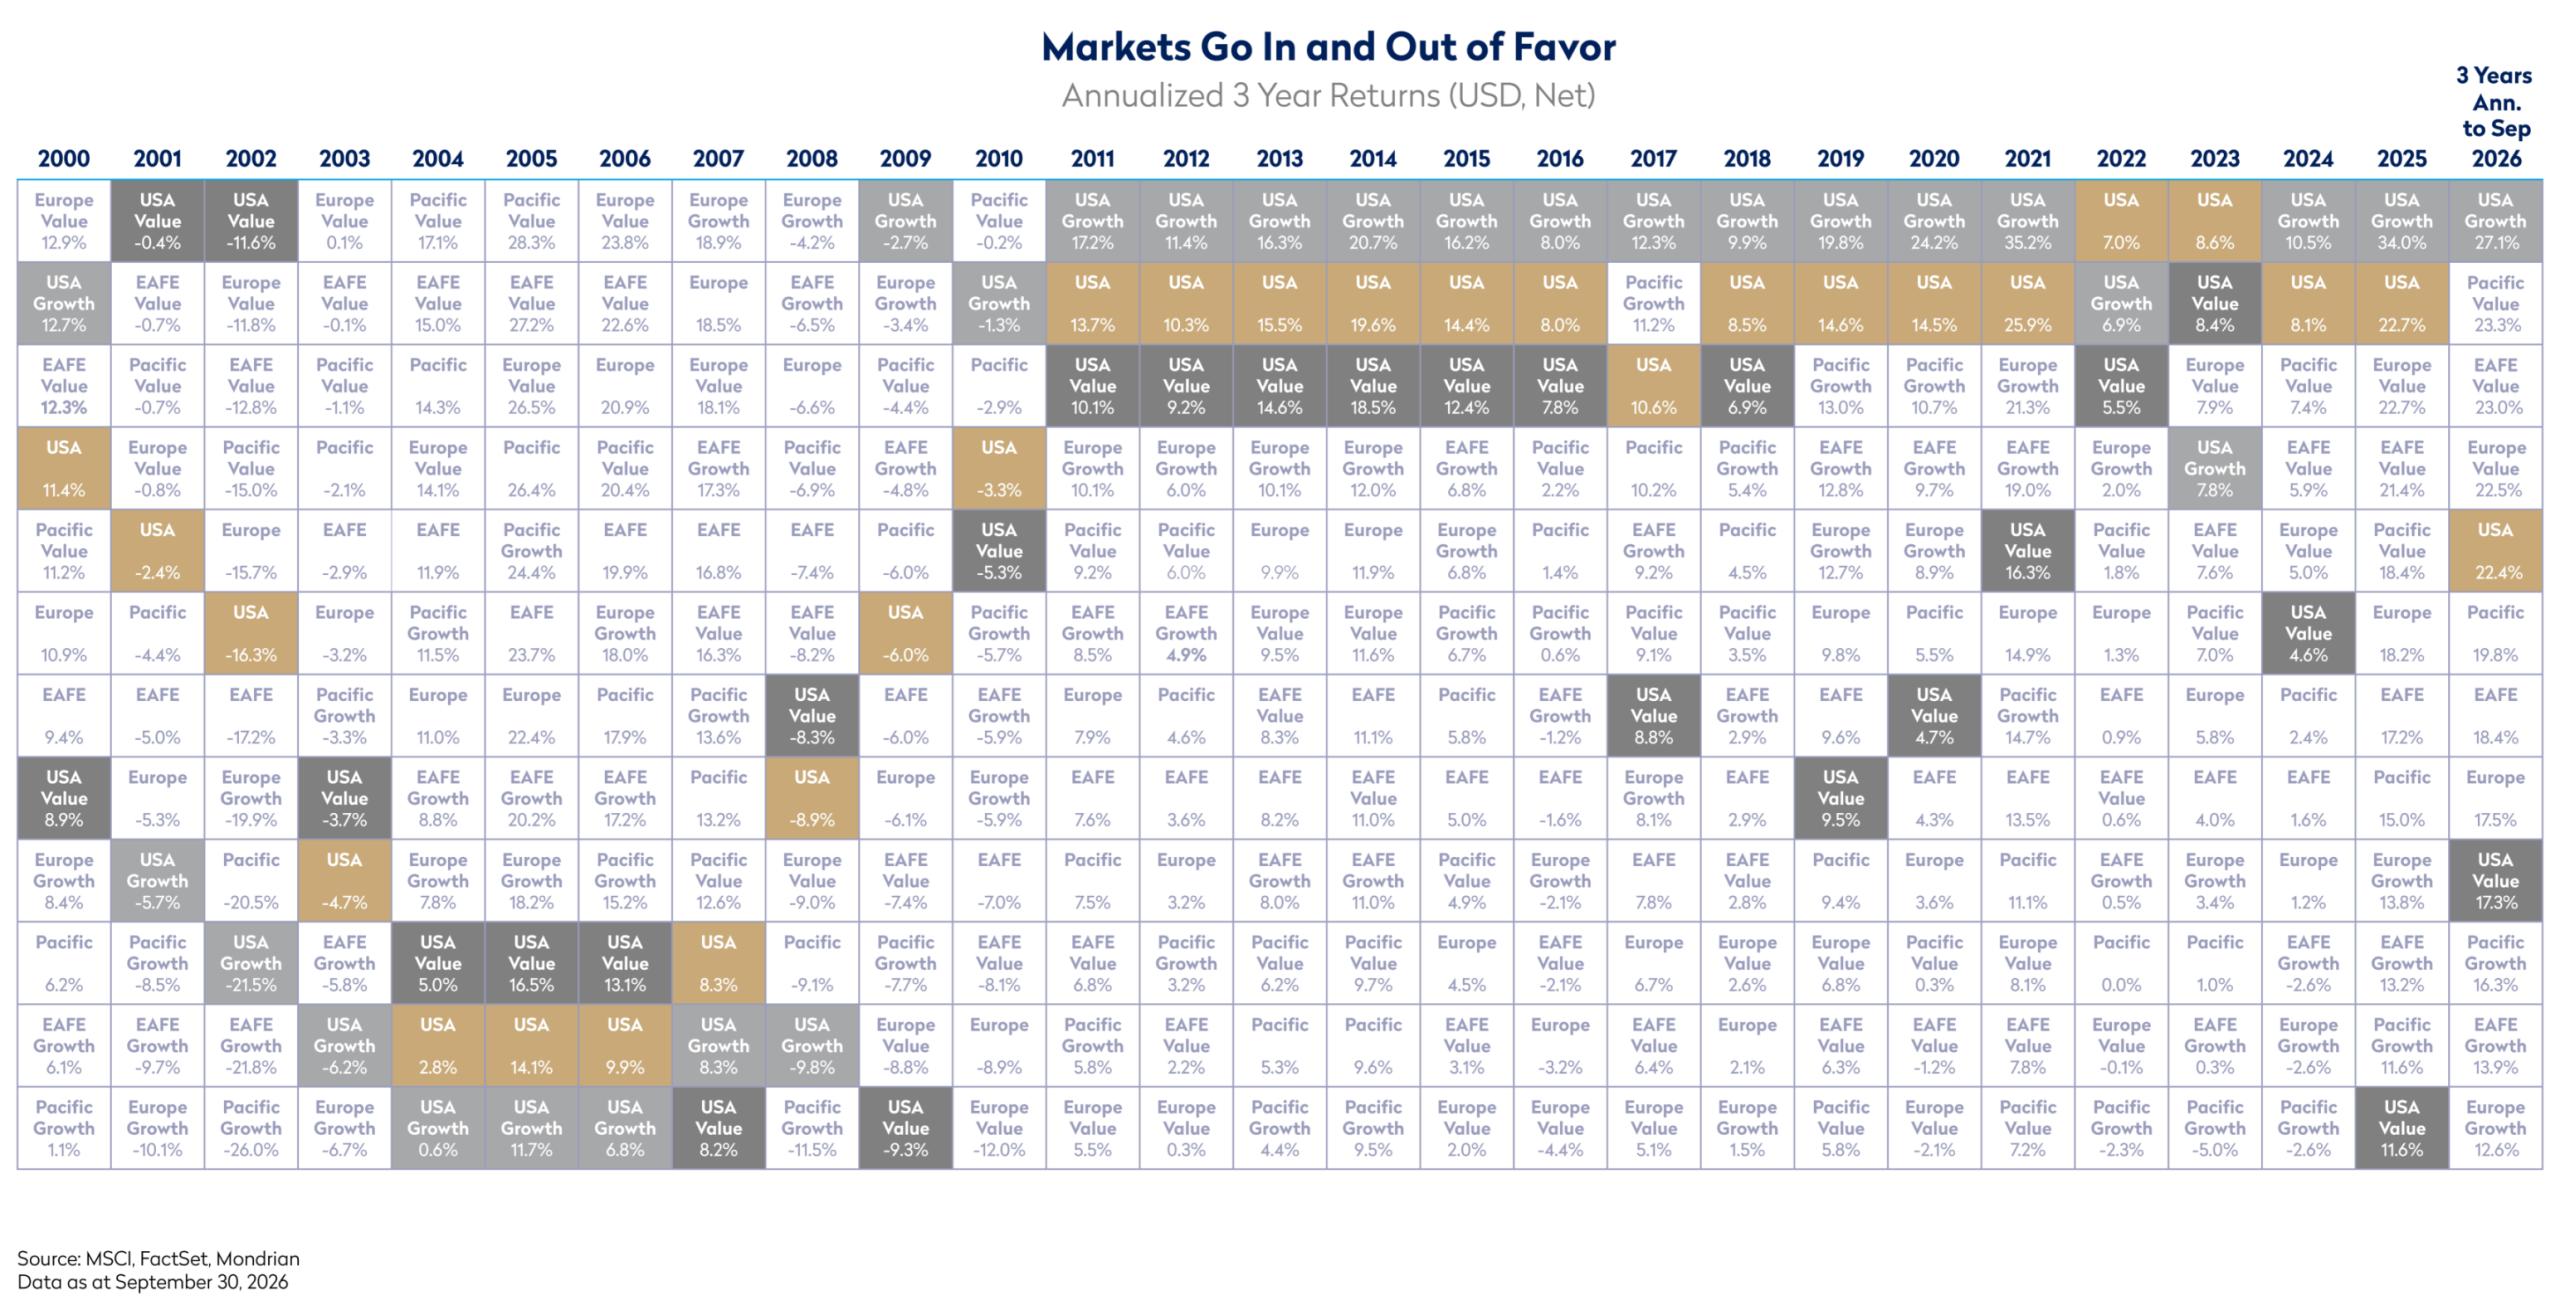
The rolling three-year rankings detailed below also show that market leadership can persist for long periods but has changed repeatedly across regions and styles. Rather than anticipating when that leadership might reverse, the focus should remain on the prospective return available at the price paid today.
A Rise in Market Concentration
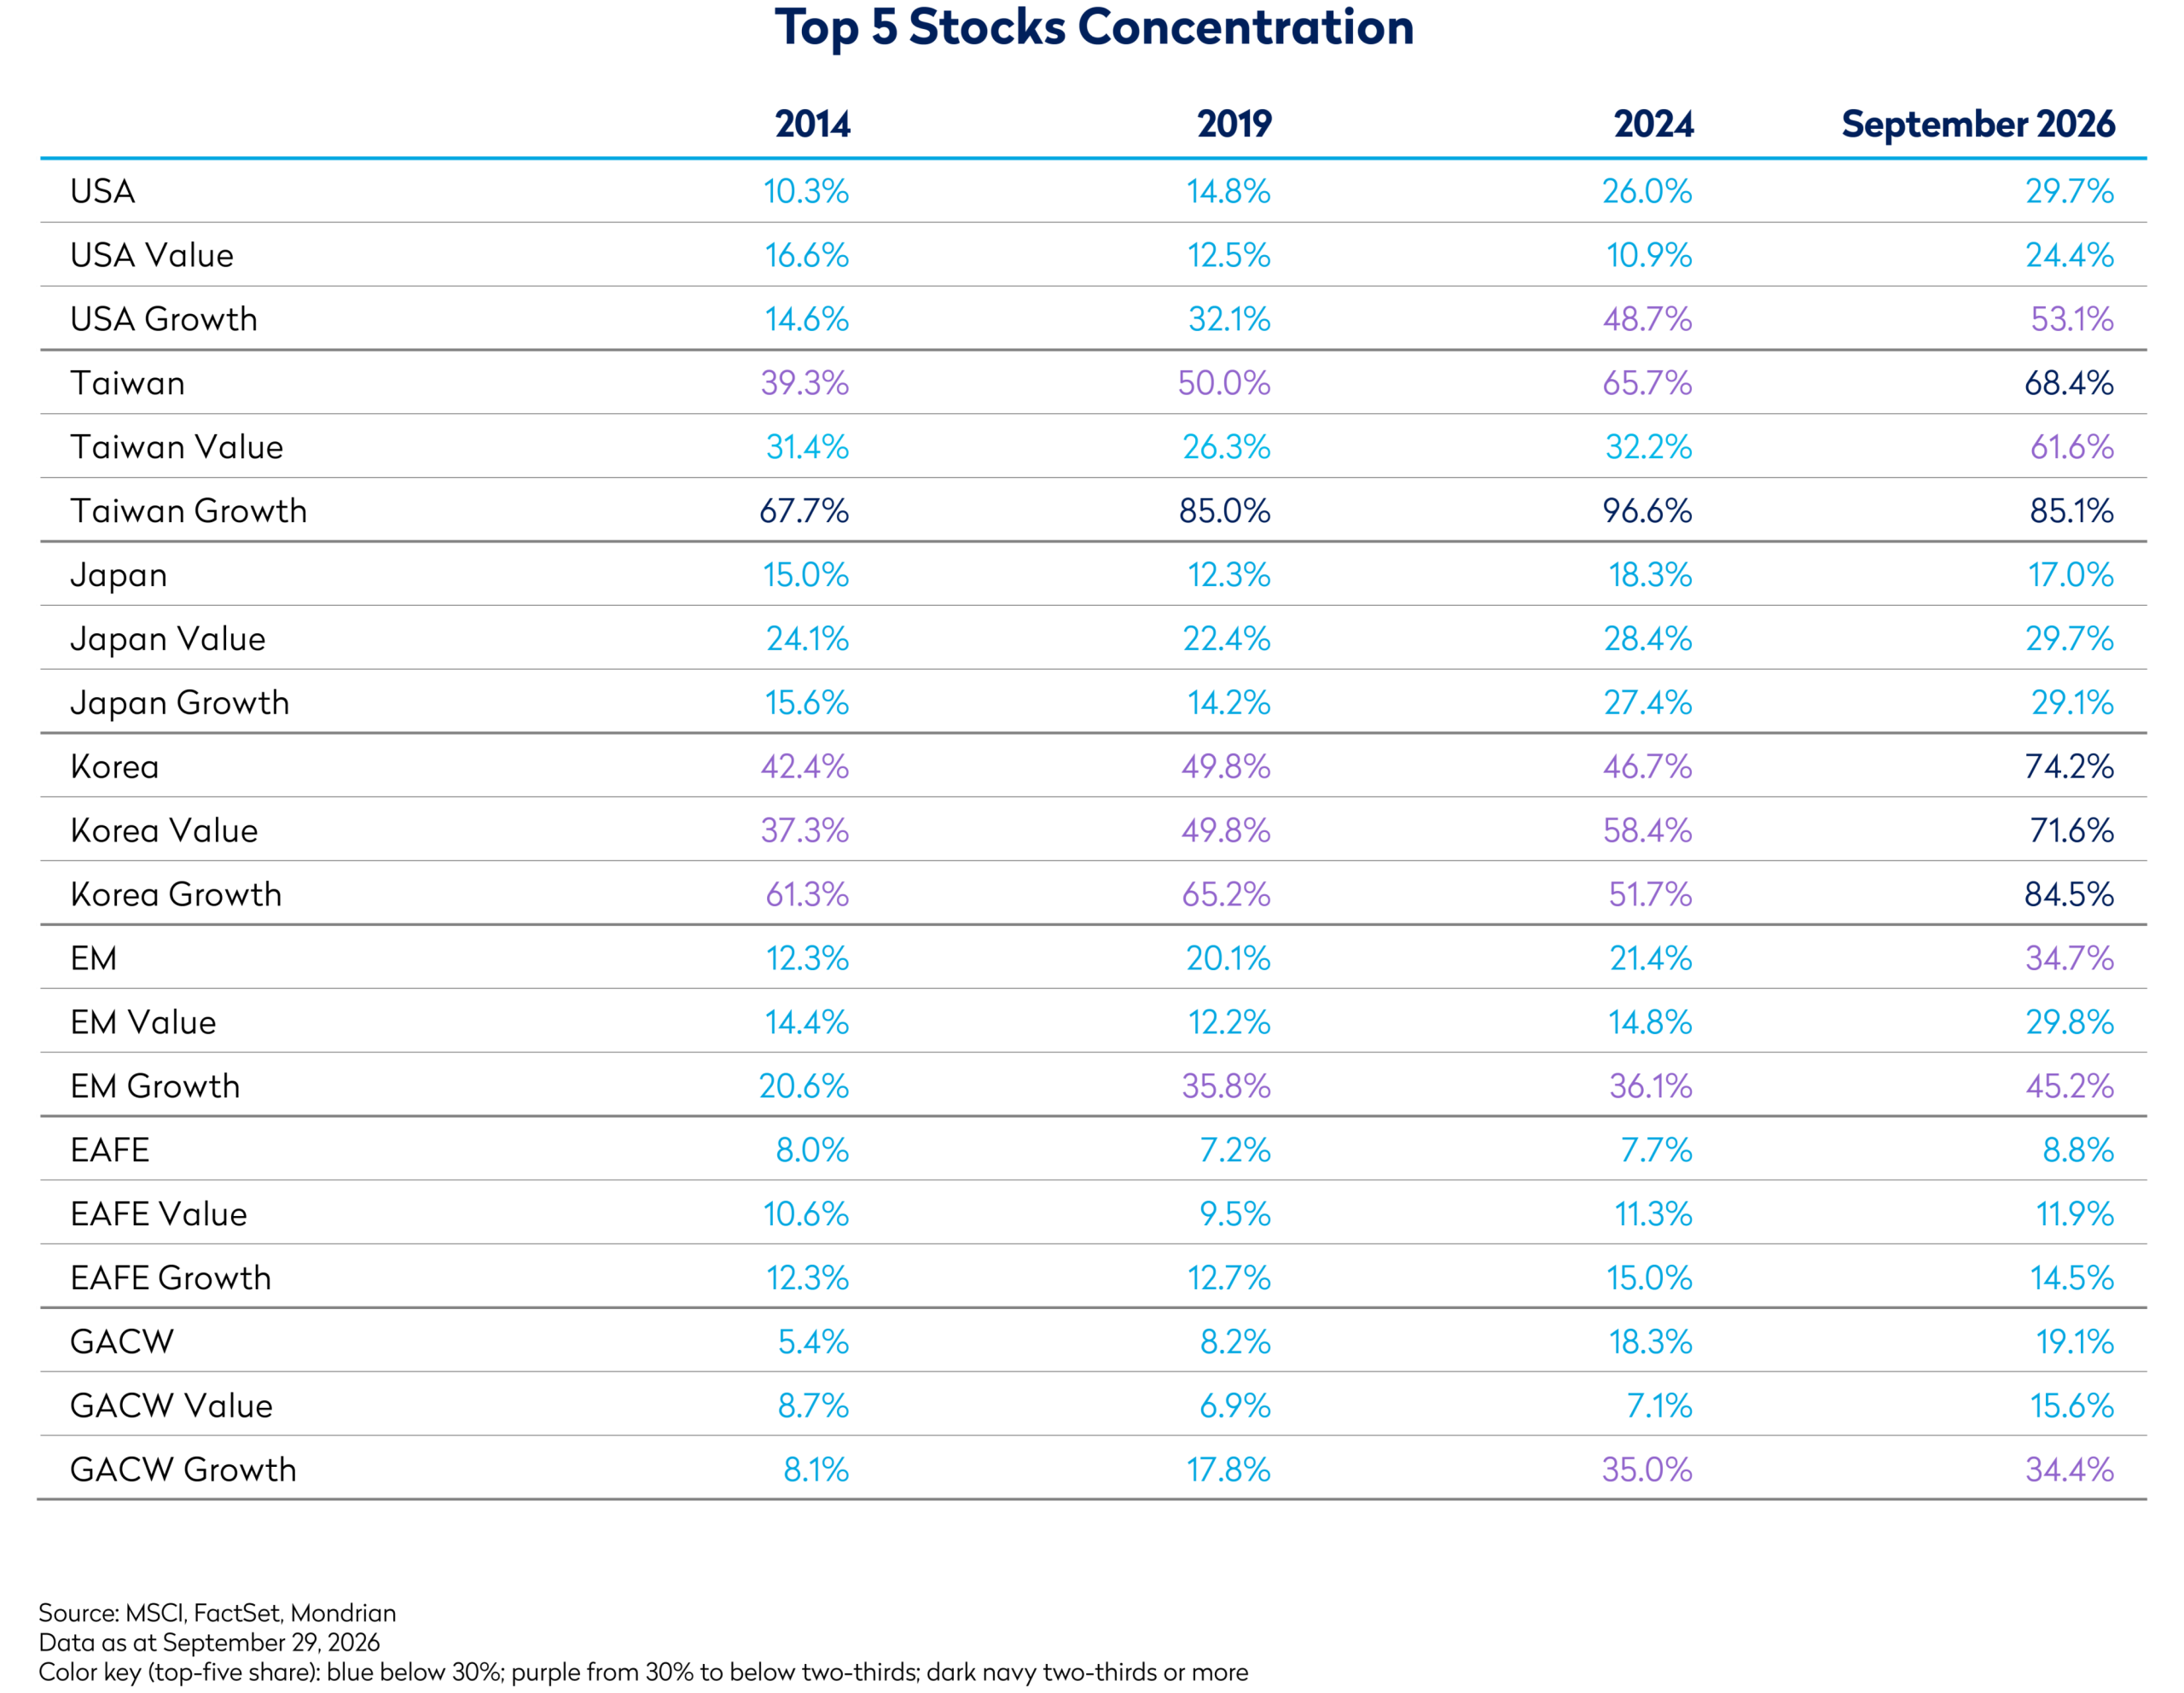
The exceptional performance of a relatively small number of companies has materially changed the composition of several major equity benchmarks. As the top-five concentration table below shows, the effect moderates across broader and more diversified market universes: in September 2026, the five largest stocks represented almost 30% of MSCI USA, compared with 19% of MSCI AC World and just 8.8% of MSCI EAFE.
The distinction between styles is even more striking. The five largest stocks made up 53.1% of MSCI USA Growth, compared with 24.4% of MSCI USA Value in September 2026. In MSCI AC World, the equivalent figures were 34.4% for Growth and 15.6% for Value; in emerging markets, 45.2% and 29.8%, respectively. EAFE remained markedly less concentrated in both styles, at 14.5% for Growth and 11.9% for Value.
These comparisons demonstrate that concentration is far from a universal equity market phenomenon. While it has increased significantly in certain markets and growth-oriented indices, more diversified investment universes, particularly developed international markets, and value benchmarks generally retain a considerably broader distribution of holdings.
Concentration is not inherently problematic. Successful companies can, and should, become larger as their earnings and cash flows grow. However, a larger benchmark weight does not necessarily imply lower stockspecific risk and can increase the influence of an individual company on overall index returns and risk. This is particularly relevant for passive and enhanced-index strategies, where portfolio exposures are closely tied to benchmark weights. For active value investors, the focus remains on assessing prospective returns and underlying risks independently, while remaining aware of the benchmark.
When Concentration Becomes Concentration of Risk
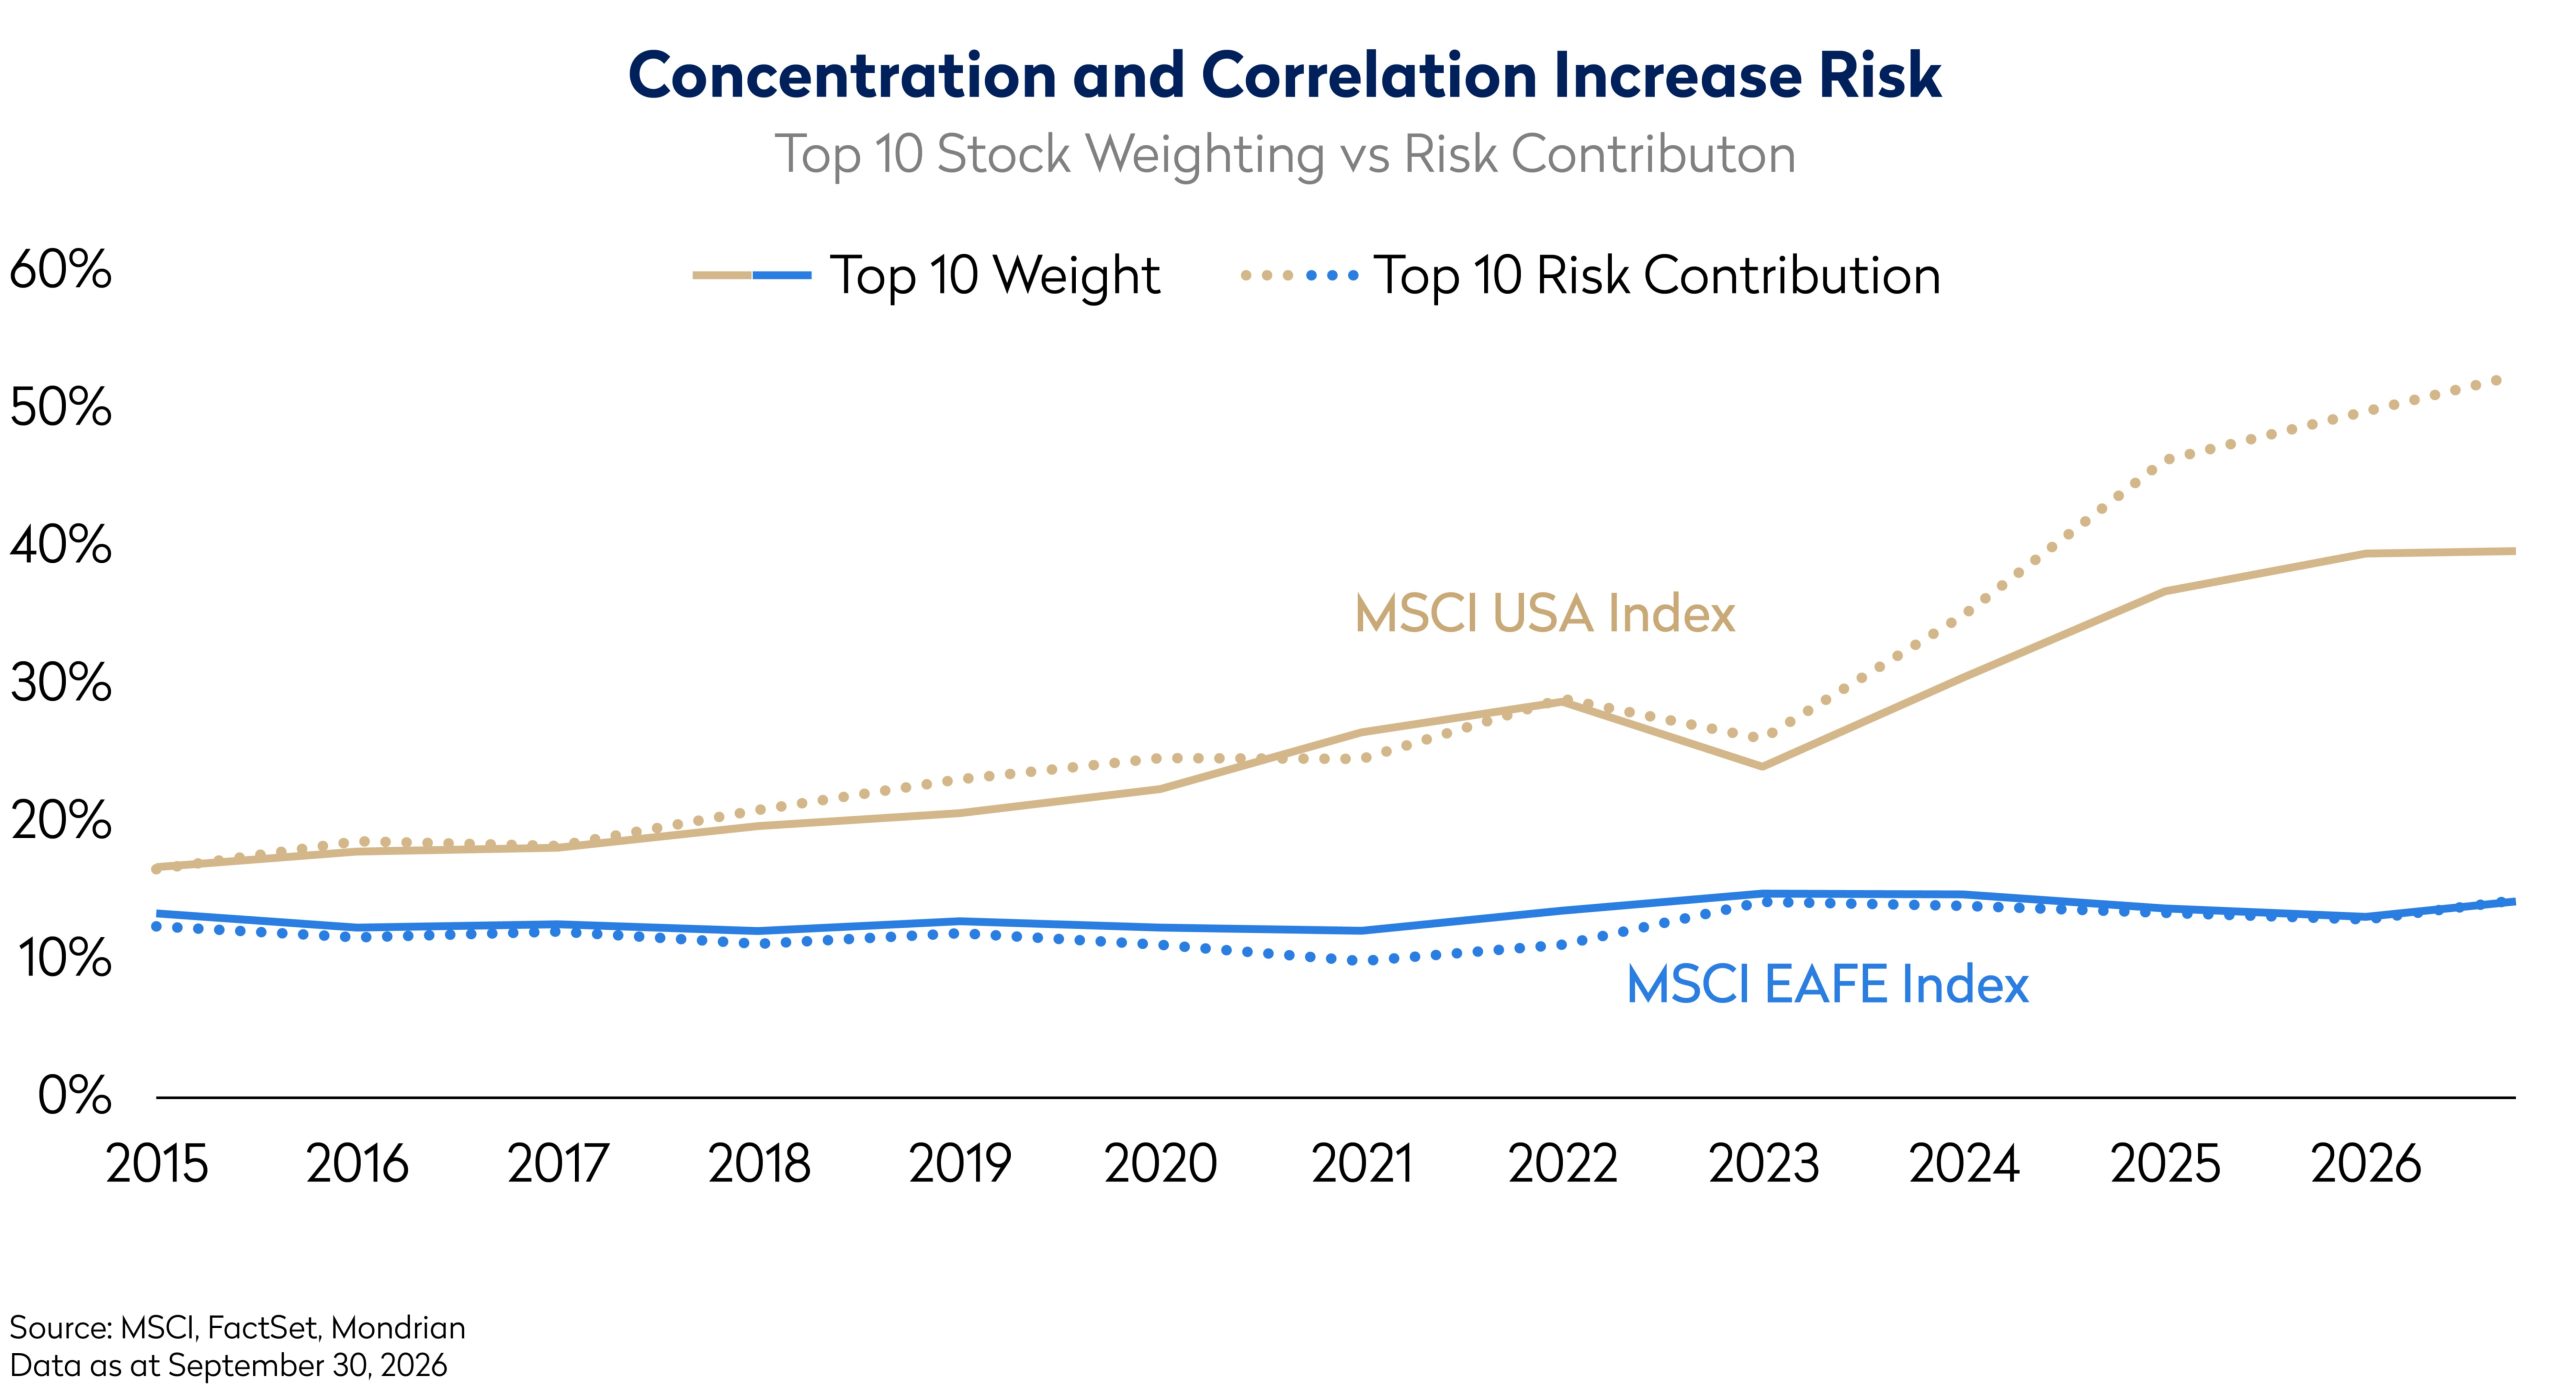
Benchmark weights tell only part of the story. Concentration becomes more consequential when the largest constituents also move increasingly in tandem. Pairwise correlations among the five largest stocks have risen in some markets, although not universally. In those cases, concentration of capital can become concentration of risk, as the top-ten weighting and risk-contribution chart below illustrates.
This is particularly evident in the US, where the ten largest stocks accounted for 52.4% of estimated index risk in September 2026, compared with 16.6% in 2015. EAFE presents a markedly different picture: the risk contribution of its ten largest constituents increased only modestly, from 12.5% to 14.3% over the same period. The chart below shows that US risk contribution has risen faster than top ten index weight, while the two measures remain much more closely aligned in EAFE.
For active managers, increasing benchmark concentration creates additional challenges. Choosing not to own a heavily weighted constituent can itself become a significant relative-risk position, even where the portfolio remains fundamentally diversified. This is particularly relevant for value managers measured against broad, non-stylized benchmarks, where the exceptional performance of a narrow group of growth stocks can increase tracking error without necessarily indicating a corresponding increase in the portfolio’s underlying absolute risk.
That distinction matters when interpreting tracking error. For an asset owner, tracking error helps assess risk against a broad, non-stylized plan benchmark, especially when growth and value sleeves have very different relative outcomes. But for an individual manager, absolute risk, including standard deviation and potential downside, should be central, with benchmark awareness informing active exposures rather than dictating security selection.
Why Value?
The case for value in today’s market is not predicated on the current market leaders becoming tomorrow’s losers. Successful companies can continue to grow, and structural trends such as AI can create significant economic value. The role of a value investor is not to dispute that potential, but to ask what return is available from the price investors are being asked to pay today.
This distinction becomes increasingly important as markets become more concentrated. Market-capweighted indices allocate more capital to companies as their share prices rise, meaning that past success can result in an increasingly large influence on future portfolio returns. A valuation-driven approach starts from a different premise: Is a security mispriced? Capital is allocated according to an independent assessment of prospective returns, based on analysis of cash flows and how they are allocated between dividends, share buybacks, reinvestment, the retirement of debt and M&A. This can be stress tested through a range of potential outcomes. The benchmark remains a reference for understanding portfolio exposures, not a substitute for fundamental valuation.
Value should therefore not be equated with buying low-multiple stocks or simply replicating a value index. A fundamental value investor can identify opportunities in growing technology companies where prospective cash flows justify an attractive return, just as a company trading on a low multiple can represent poor value if its fundamentals are deteriorating. While recent growth leadership has been reinforced by strong price momentum, value investing seeks to benefit from the potential convergence of share prices towards their intrinsic worth. Rather than relying on the continuation of recent market trends, a disciplined value approach identifies opportunities where current valuations do not adequately reflect long-term fundamentals.
In an environment where market concentration has increased significantly in certain areas, active value investing provides the flexibility to seek attractive prospective real returns across a broader opportunity set, without being compelled to follow the growing weight of the largest benchmark constituents.
Conclusion
The concentration of market capitalization and risk in a relatively small group of companies has created significant challenges in certain equity markets. Yet the experience across more diversified investment universes and value benchmarks demonstrates that these challenges are far from universal.
For active value investors, the distinction between benchmark-relative and absolute risk remains particularly important. Benchmark awareness can inform portfolio construction without overriding fundamental judgement, allowing investment decisions to remain grounded in intrinsic value, prospective real returns and an independent assessment of risk.
Ultimately, the case for active value does not depend on predicting when growth leadership will reverse. It rests on the ability to identify attractive investment opportunities across a diversified universe, while maintaining the valuation discipline and flexibility to construct portfolios independently of increasingly concentrated benchmarks.
Disclosures
Views expressed were current as of the date indicated, are subject to change, and may not reflect current views. All information is subject to change without notice. Views should not be considered a recommendation to buy, hold or sell any investment and should not be relied on as research or advice.
This document may include forward-looking statements. All statements other than statements of historical facts are forward-looking statements (including words such as “believe,” “estimate,” “anticipate,” “may,” “will,” “should,” “expect”). Although we believe that the expectations reflected in such forward-looking statements are reasonable, we can give no assurance that such expectations will prove to be correct. Various factors could cause actual results to differ materially from those reflected in such forward-looking statements.
Neither MSCI nor any other party involved in or related to compiling, computing or creating the MSCI data makes any express or implied warranties or representations with respect to such data (or the results to be obtained by the use thereof), and all such parties hereby expressly disclaim all warranties of originality, accuracy, completeness, merchantability or fitness for a particular purpose with respect to any of such data. Without limiting any of the foregoing, in no event shall MSCI, any of its affiliates or any third party involved in or related to compiling, computing, or creating the data have any liability for any direct, indirect, special, punitive, consequential or any other damages (including lost profits) even if notified of the possibility of such damages. No further distribution or dissemination of the MSCI data is permitted without MSCI’s express written consent.
This material is for informational purposes only and is not an offer or solicitation with respect to any securities. Any offer of securities can only be made by written offering materials. The information set forth herein is a summary only and does not set forth all of the risks associated with the investment strategy described herein.
The information was obtained from sources we believe to be reliable, but its accuracy is not guaranteed, and it may be incomplete or condensed.
It should not be assumed that investments made in the future will be profitable or will equal the performance of any security referenced in this document. Examples of securities will represent only a small part of the overall portfolio and are used to illustrate our investment approach. Any holdings are subject to change and may not feature in any future portfolio. More information on holdings is available on request.
Unless otherwise stated, all returns are in USD.
All references to index returns assume the reinvestment of dividends after the deduction of withholding tax and approximate the minimum possible re-investment, unless the index is specifically described as a “Gross” index.
Past performance is not a guarantee of future results. An investment involves the risk of loss. The investment return and value of investments will fluctuate.
Mondrian Investment Partners Limited is authorized and regulated by the Financial Conduct Authority (Firm Reference Number: 149507). Mondrian Investment Partners Limited is also registered as an Investment Adviser with the Securities and Exchange Commission (registration does not imply any level of skills or training).
This marketing communication is for Professional Investors only.