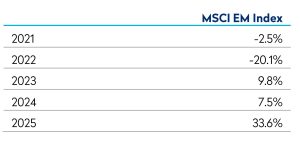

Emerging markets (EM) staged an impressive rally in the second quarter, returning 24%, despite the lingering conflict in the Middle East and its impact on commodity prices, inflation and global growth. At first glance, investors appeared willing to look through the geopolitical uncertainty and refocus on corporate earnings. However, rather than illustrating broad market resilience, this rebound has been propelled by a limited number of Artificial Intelligence (AI) related stocks. Strip out the Asian technology hardware companies riding the AI capex wave, and the picture becomes considerably more modest. This quarter’s market advance has therefore been unusually narrow, raising important questions about the increasing concentration of market leadership by stock, country, and sector within EM. With similar patterns in the US market, the outlook for global equities could turn sharply if sentiment towards AI linked names reversed. In this quarter’s outlook we will analyse the changing shape of the MSCI EM Index, what this has meant for performance, and how it influences forward looking expectations.
A Market Defined by Narrowness
Almost the entirety of the MSCI EM Index’s 24% gain in both Q2 and year to date can be attributed to a single area of the market, Asian IT hardware stocks. The IT sector, ex the very small sub sector of software and services which is perceived to be a net loser from AI, was up 73% in Q2 and 93% year to date. The next best sector is industrials which is up around 20%. Most other sectors were actually down. The overwhelming majority of index returns therefore came from hardware, semiconductors, and semiconductor equipment stocks that are exposed to a single theme – the insatiable demand from hyperscalers and AI infrastructure builders for the most advanced chips in the world. Within that cohort, just 6 names account for the overwhelming share of the contribution – TSMC, Samsung Electronics, SK Hynix (and SK Square), MediaTek and Delta Electronics.
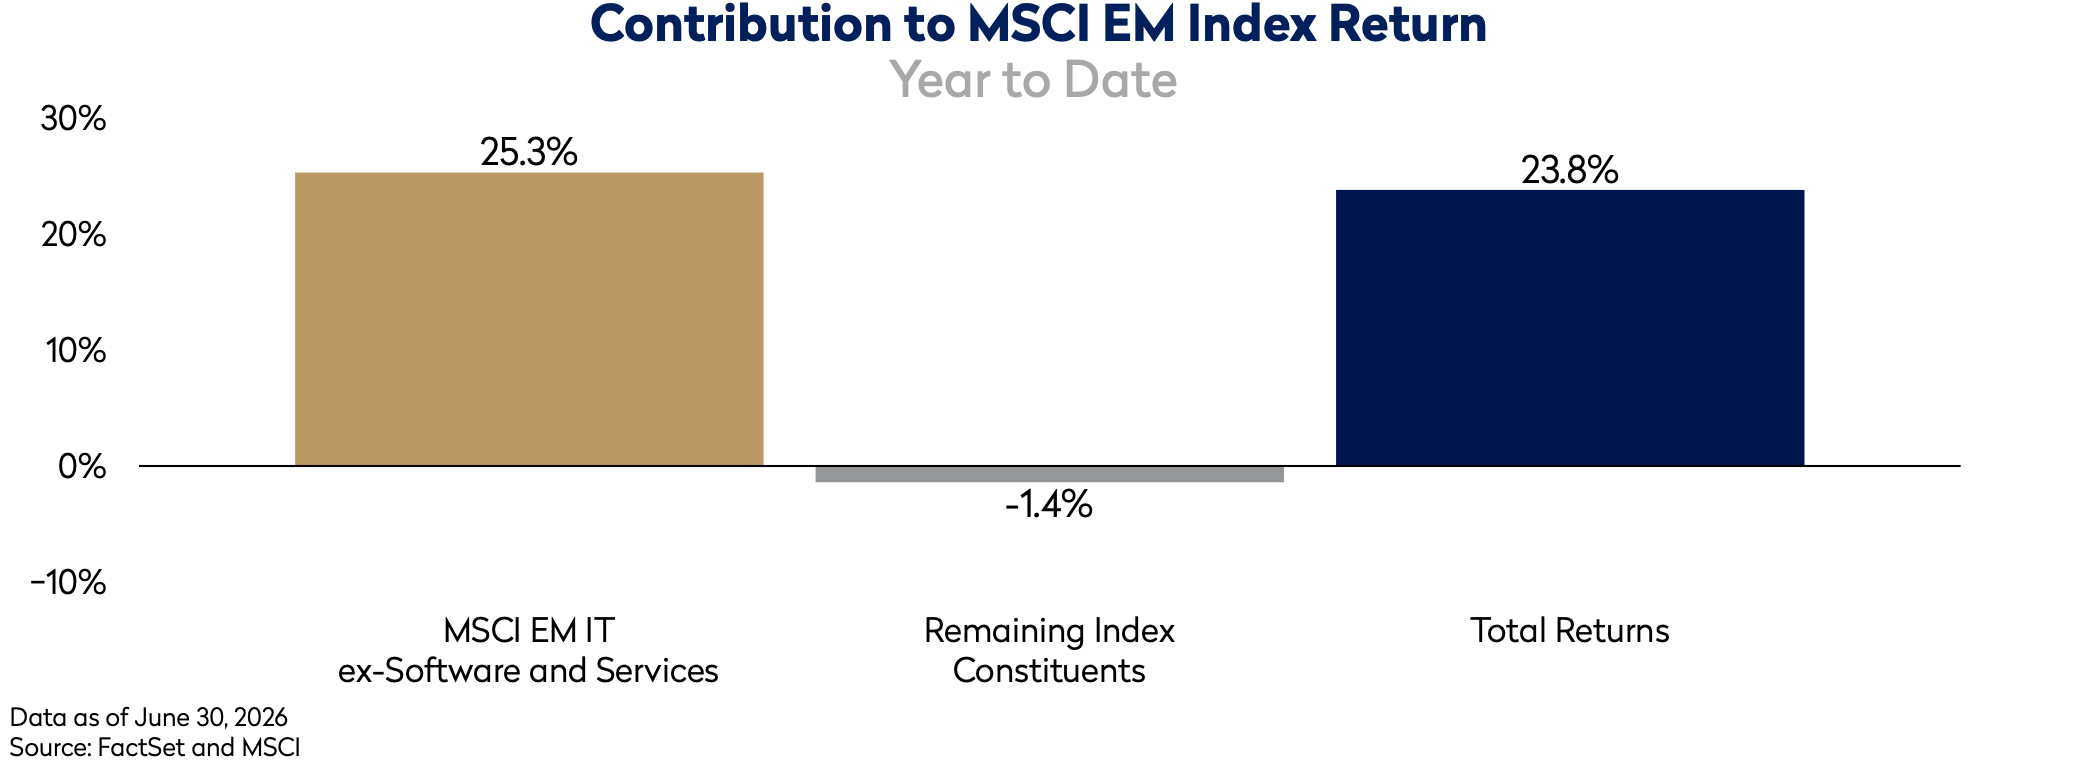
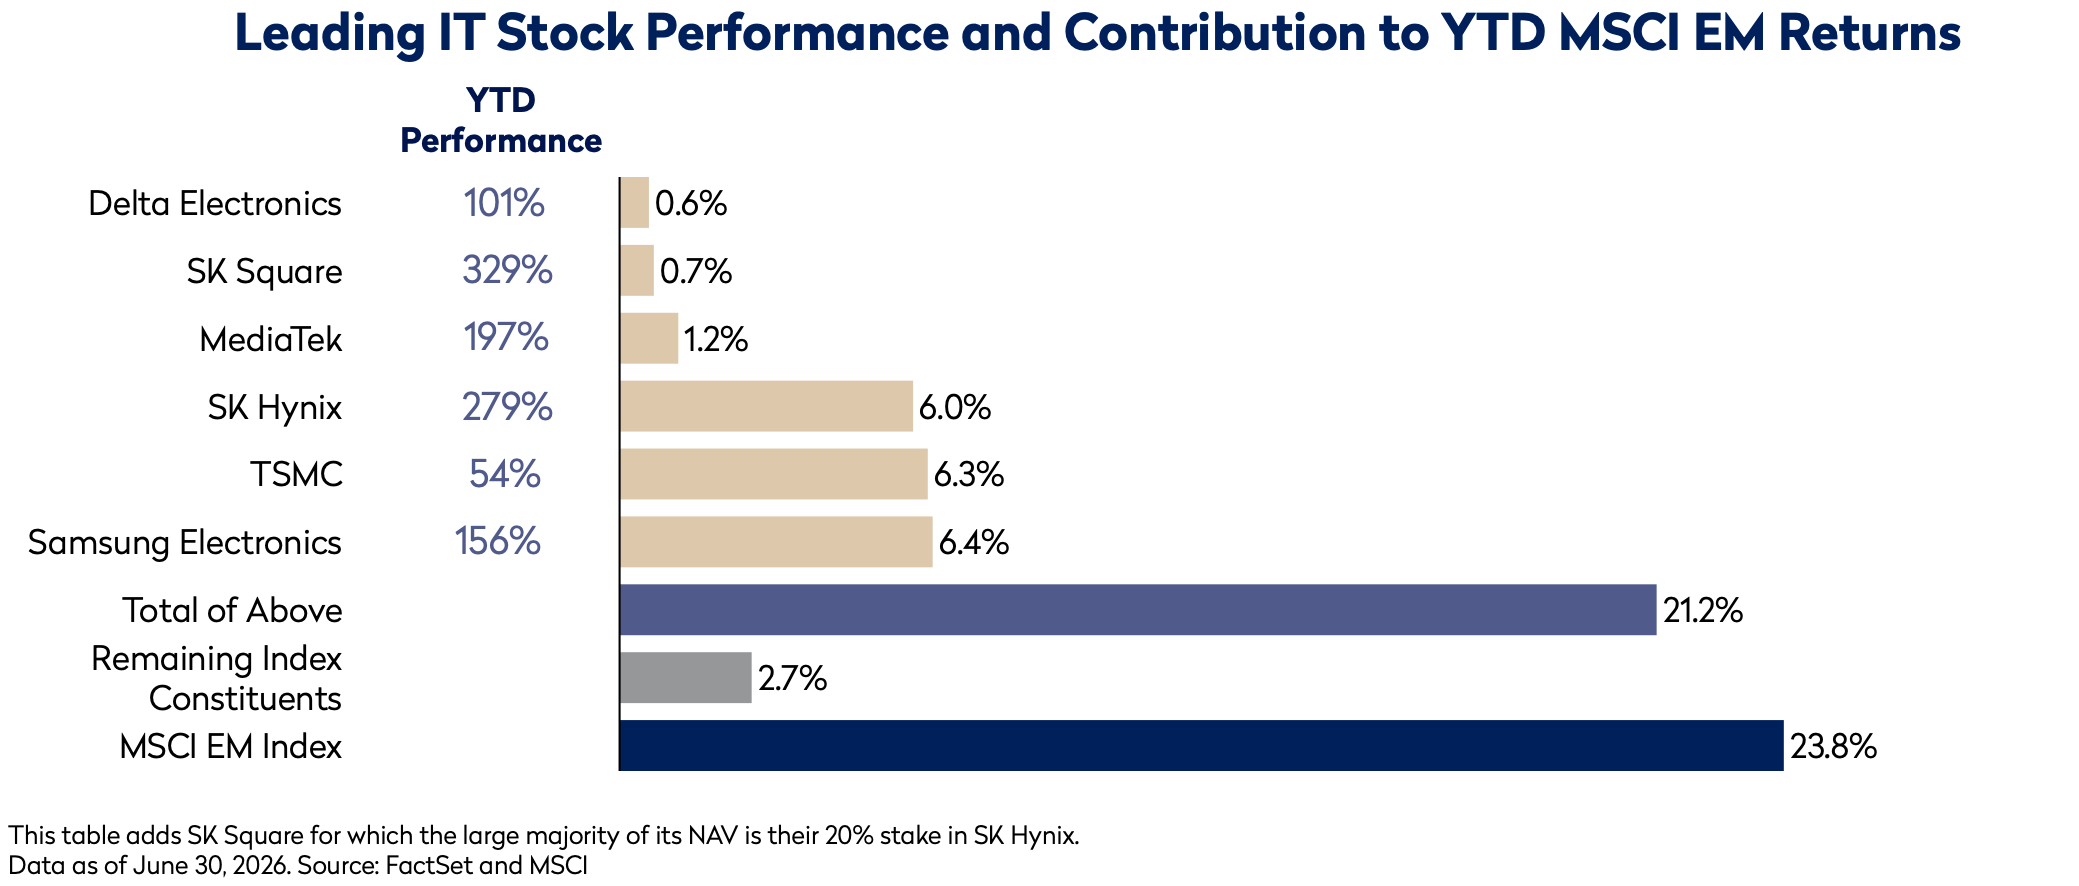
For active managers, this has created profound challenges because underweights to any of these areas has not been compensated for by almost any other sector or country exposures. These recent outsized moves have changed the composition of an investment in MSCI EM.
How the EM Index has been Reshaped
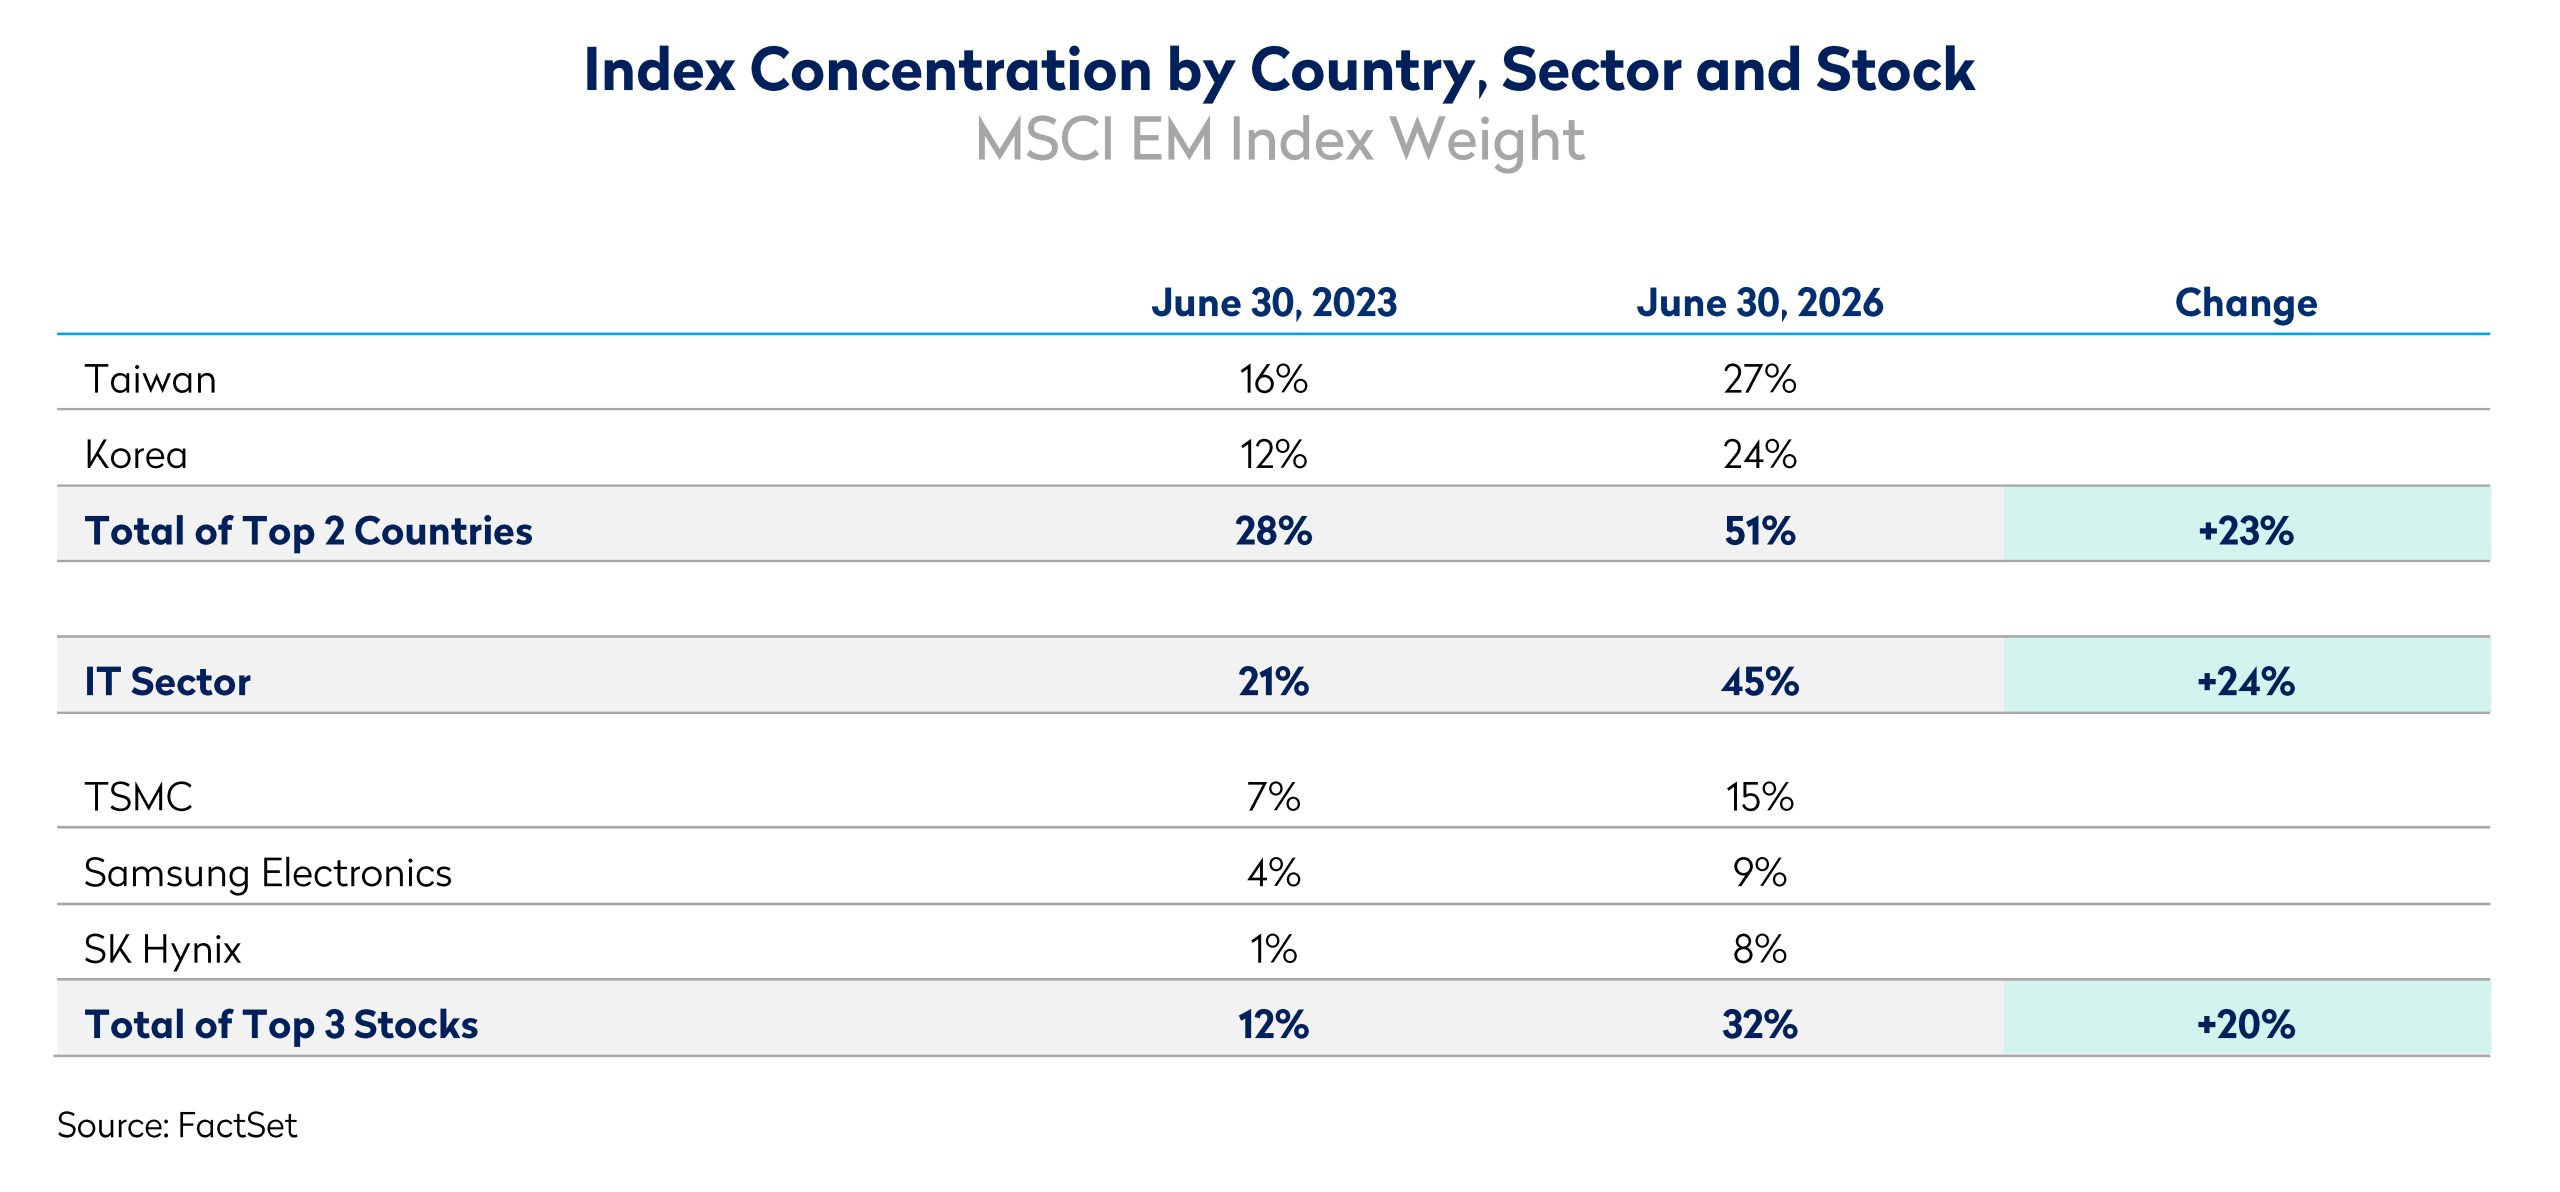
Five years ago, the defining question for EM investors related to China which sat at c.35% of the MSCI EM index, and a view on China was in many ways a view on EM. That world has changed materially. Three years ago, its weight had fallen to 30%, and it now represents 19% of the index having been relegated to the third largest market. China’s declining weight reflects more than just several years of equity market underperformance. It is equally a consequence of the extraordinary rise of Taiwan and Korea, driven by their central role in the global AI hardware supply chain. Taiwan and Korea have almost doubled in weight to account for just over half of EM today. Their growth largely mirrors the growth of IT as a sector in EM which has more than doubled to 45%. Most of this can be attributed to the growth of Asia’s three largest tech companies. TSMC, Samsung Electronics and SK Hynix now represent 32% of MSCI EM compared to 12% three years ago.
The table below highlights this shift over the last 3 years, and the index concentration it has led to. The practical implication is stark: a passive allocation to the EM index is, to a substantial degree, a concentrated bet on Taiwanese and Korean semiconductor manufacturing capacity and its exposure to the global AI build out. For active investors such as Mondrian, it creates challenges too. Stock level concentration has risen to previously unprecedented levels, raising difficult dilemmas regarding portfolio construction, tracking error and absolute risk.
The AI Capex Supercycle and its Valuation Challenges
The exceptional returns generated by AI hardware companies within EM are underpinned by near term economic reality. US hyperscalers including Microsoft, Amazon, Alphabet and Meta are expected to invest more than USD 700bn in capital expenditure during 2026, with the bulk directed towards data centres, networking infrastructure and advanced semiconductors. TSMC remains the primary beneficiary, while leading memory producers such as Samsung, SK Hynix and Micron are experiencing an unprecedented surge in profitability as supply struggles to meet demand.
The valuation challenge is that this powerful new demand driver has emerged within one of the market’s most historically cyclical industries. While AI clearly represents a structural source of demand deserving higher valuations, markets increasingly appear to be capitalising today’s earnings as though they represent a new normal. Headline semiconductor valuations look reasonable on forward earnings, but this masks a more demanding picture. Excluding memory companies, whose record earnings keep index multiples low, many AI beneficiaries now trade well above their historical valuation ranges despite already enjoying exceptional demand and margin expansion.
This optimism assumes AI infrastructure spending will remain elevated for many years. Yet even if hyperscaler capex continues to grow through 2027, sustaining current growth rates becomes progressively harder as the spending base expands. AI adoption can continue to accelerate even as infrastructure investment moderates. Over time, additional capacity should ease supply constraints, while improvements in utilisation, workload routing and inference efficiency are likely to reduce compute intensity. Many of today’s “picks and shovels” beneficiaries therefore appear priced for a longer period of extraordinary growth and profitability than we consider likely.
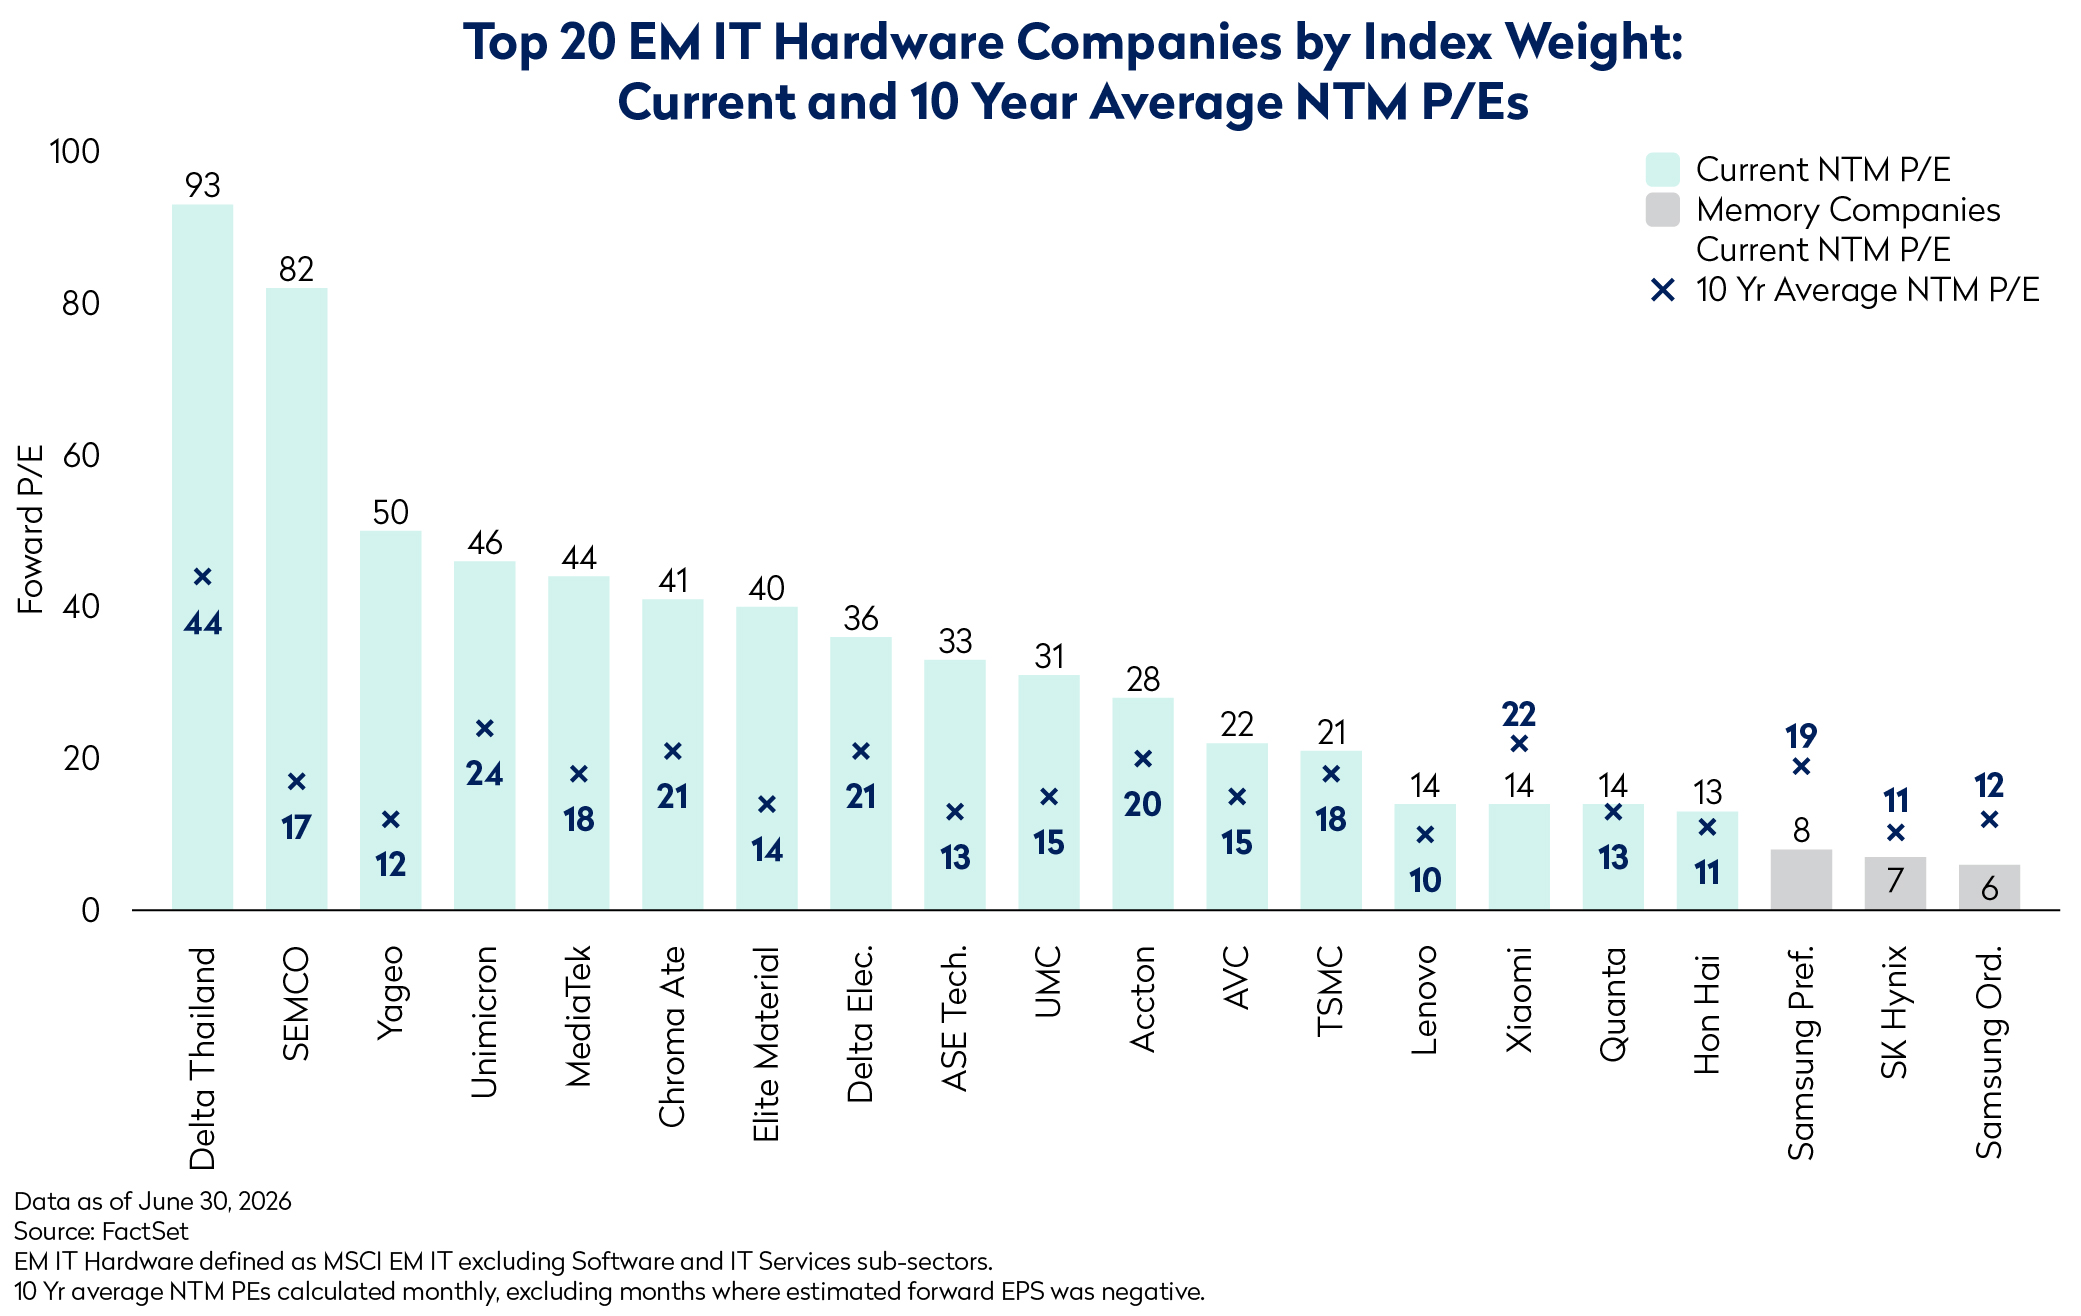
The memory sector deserves separate consideration because it sits at the centre of the debate between structural change and cyclical history. Today’s earnings are being driven by exceptionally strong pricing and gross margins above 80%, yet memory has historically been one of the semiconductor industry’s most cyclical segments. As a result, investors have traditionally placed greater emphasis on P/B multiples than P/E multiples. Today, P/B multiples have moved well beyond previous peaks, while forward P/E multiples remain in single digits. This divergence reflects uncertainty over how much of today’s earnings should be viewed as sustainable.
There are reasons to believe this cycle may prove different. Multi year customer agreements and the increasingly strategic role of high bandwidth memory within AI infrastructure suggest industry economics could be structurally stronger than in previous cycles. We therefore retain meaningful exposure to the memory sector, recognising both its critical role in the AI build out and the potential for lasting structural improvement. Nevertheless, our positioning reflects probabilities rather than conviction in a single outcome. Even under optimistic assumptions, we believe current earnings are unlikely to prove fully sustainable and remain cautious about capitalising today’s profits too far into the future.
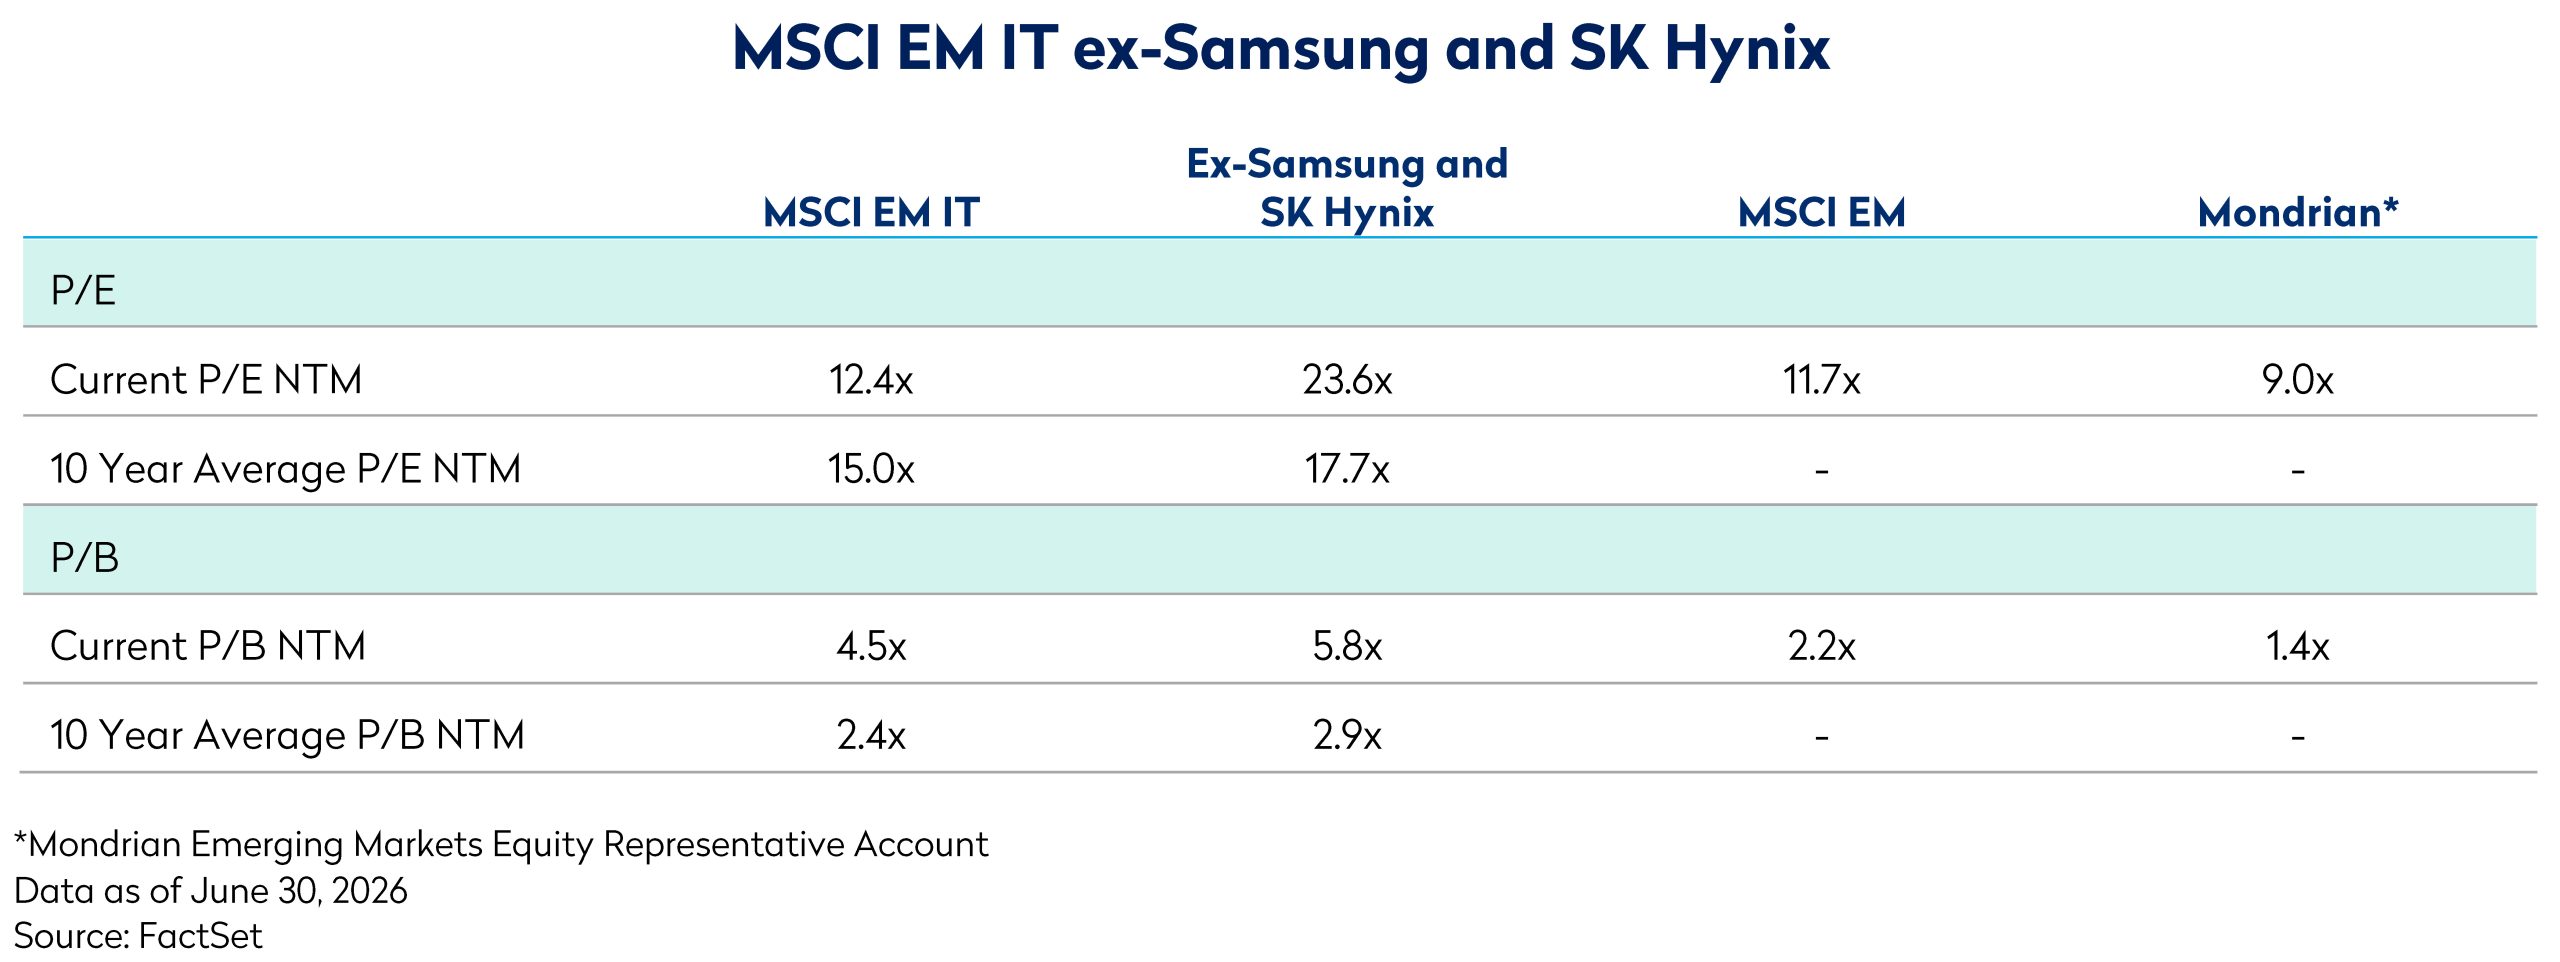
Following an extraordinary period of share price appreciation, many AI related technology companies are arguably priced for near flawless execution. While the long-term potential of AI remains compelling, current valuations increasingly discount sustained high growth, expanding margins and continued heavy capital investment delivering attractive returns. History suggests that transformative technologies often create enormous value for society, but rarely for investors who overpay during periods of peak optimism. As expectations become more demanding, even strong operational performance may prove insufficient to justify prevailing valuations, leaving these stocks vulnerable to disappointment if growth moderates, competitive pressures intensify or returns on AI investment fall short of expectations.
Conclusion
Q2 has been particularly challenging for Mondrian’s value investment style despite maintaining substantial absolute exposure to IT companies. Our approximate 10% underweight to the sector has detracted from relative performance given the extraordinary concentration and degree of market returns discussed above.
However, periods such as these are not unusual in long-term investing. Markets periodically become dominated by a single theme, and the resulting concentration can leave disciplined valuation based approaches temporarily out of favor. History also suggests that such periods rarely persist indefinitely.
Our investment philosophy remains centered on identifying businesses capable of delivering attractive long term returns while maintaining an appropriate balance between valuation, quality and risk. Today that still leads us to meaningful exposure in the AI opportunity, but through companies where we believe expectations remain achievable and valuations continue to offer an attractive margin of safety.
We therefore remain confident that maintaining diversification and valuation discipline, rather than pursuing increasingly concentrated momentum, provides the best foundation for delivering attractive long-term returns for our clients.
Disclosures
Views expressed were current as of the date indicated, are subject to change, and may not reflect current views. All information is subject to change without notice. Views should not be considered a recommendation to buy, hold or sell any investment and should not be relied on as research or advice.
This document may include forward-looking statements. All statements other than statements of historical facts are forward-looking statements (including words such as “believe,” “estimate,” “anticipate,” “may,” “will,” “should,” “expect”). Although we believe that the expectations reflected in such forward-looking statements are reasonable, we can give no assurance that such expectations will prove to be correct. Various factors could cause actual results to differ materially from those reflected in such forward-looking statements.
Neither MSCI nor any other party involved in or related to compiling, computing or creating the MSCI data makes any express or implied warranties or representations with respect to such data (or the results to be obtained by the use thereof), and all such parties hereby expressly disclaim all warranties of originality, accuracy, completeness, merchantability or fitness for a particular purpose with respect to any of such data. Without limiting any of the foregoing, in no event shall MSCI, any of its affiliates or any third party involved in or related to compiling, computing, or creating the data have any liability for any direct, indirect, special, punitive, consequential or any other damages (including lost profits) even if notified of the possibility of such damages. No further distribution or dissemination of the MSCI data is permitted without MSCI’s express written consent.
This material is for informational purposes only and is not an offer or solicitation with respect to any securities. Any offer of securities can only be made by written offering materials. The information set forth herein is a summary only and does not set forth all of the risks associated with the investment strategy described herein.
The information was obtained from sources we believe to be reliable, but its accuracy is not guaranteed, and it may be incomplete or condensed.
It should not be assumed that investments made in the future will be profitable or will equal the performance of any security referenced in this document. Examples of securities will represent only a small part of the overall portfolio and are used to illustrate our investment approach. Any holdings are subject to change and may not feature in any future portfolio. More information on holdings is available on request.
Unless otherwise stated, all returns are total returns in USD.
All references to index returns assume the reinvestment of dividends after the deduction of withholding tax and approximate the minimum possible re-investment, unless the index is specifically described as a “Gross” index.
Past performance is not a guarantee of future results. An investment involves the risk of loss. The investment return and value of investments will fluctuate.
Mondrian Investment Partners Limited is authorized and regulated by the Financial Conduct Authority (Firm Reference Number: 149507). Mondrian Investment Partners Limited is also registered as an Investment Adviser with the Securities and Exchange Commission (registration does not imply any level of skills or training).