
A Five-Pillar Case for Reassessing Equity Allocations
For more than a decade, US equities have dominated global markets, driven by exceptional earnings growth, technological leadership, and a materially appreciating US dollar. Strong domestic economic expansion and supportive fiscal policy reinforced this advantage, while the dollar’s strength created a persistent headwind for international investors. Unsurprisingly, global equity markets have become increasingly concentrated in US securities.
By the end of 2024, international equities were trading at their widest relative valuation discount to the US in decades. In 2025 however, leadership began to shift. Historically wide valuation disparities, policy uncertainty, and a weakening US dollar contributed to international markets outperforming the US, marking a notable change in direction.
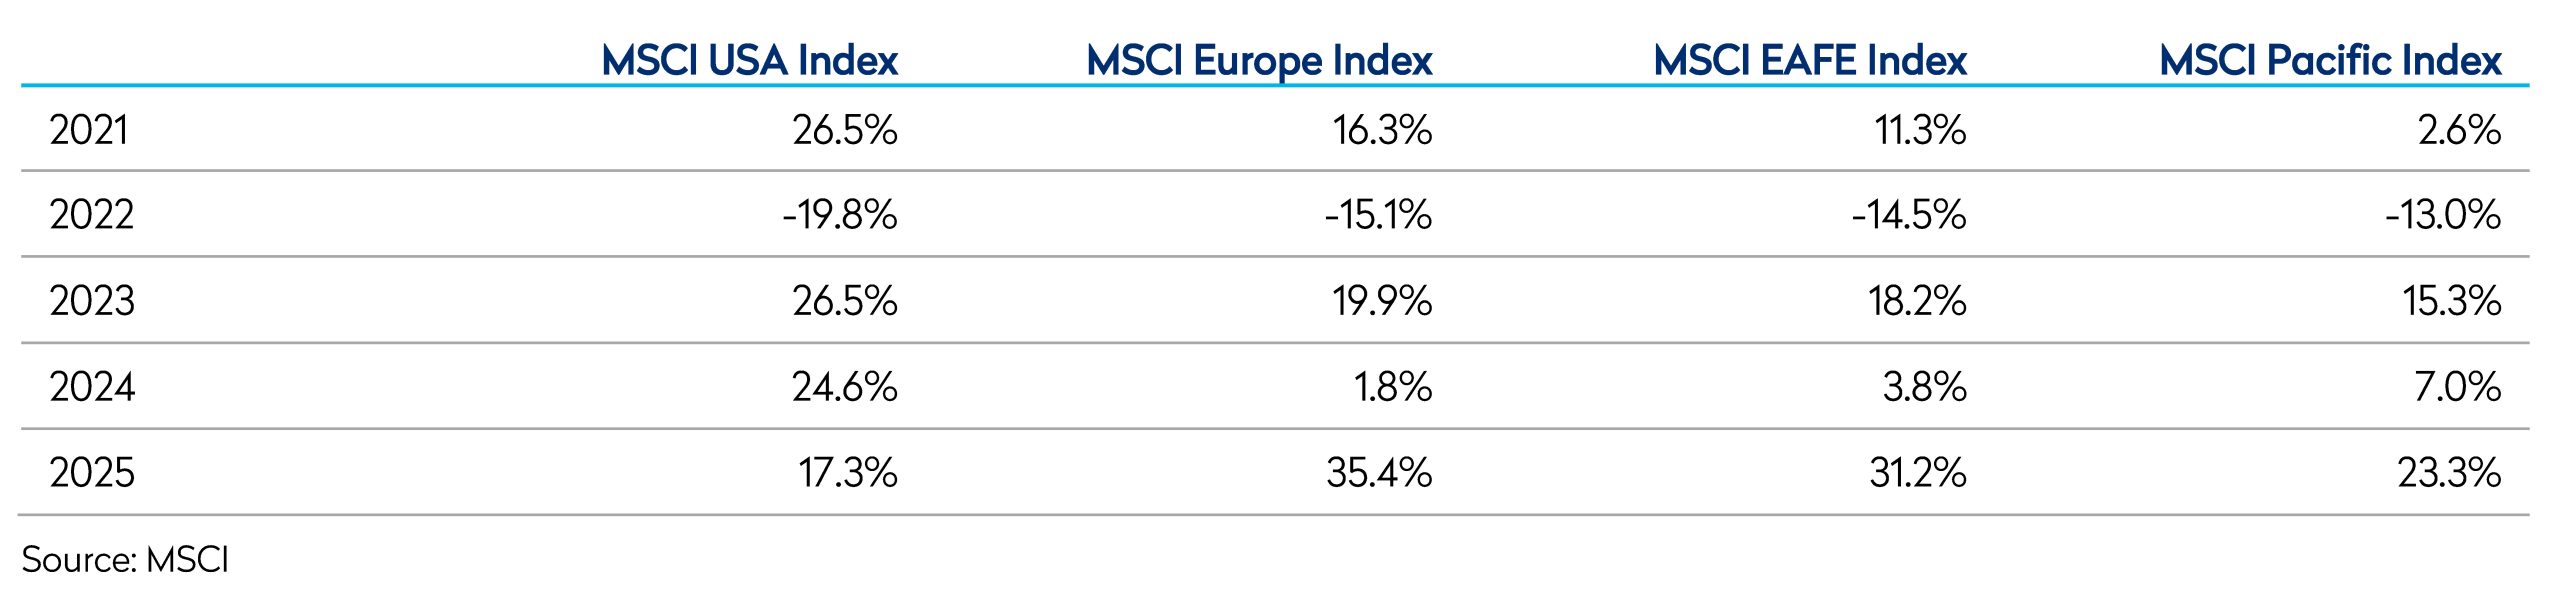
While one year does not define a new regime as history and the chart below demonstrate, markets go in and out of favor. While it is impossible to tell when a market will lag, history will tell us that no single market outperforms in perpetuity. Extended periods of dominance often give rise to valuation extremes, heightened concentration risk, and positioning imbalances that materially reshape forward return expectations.
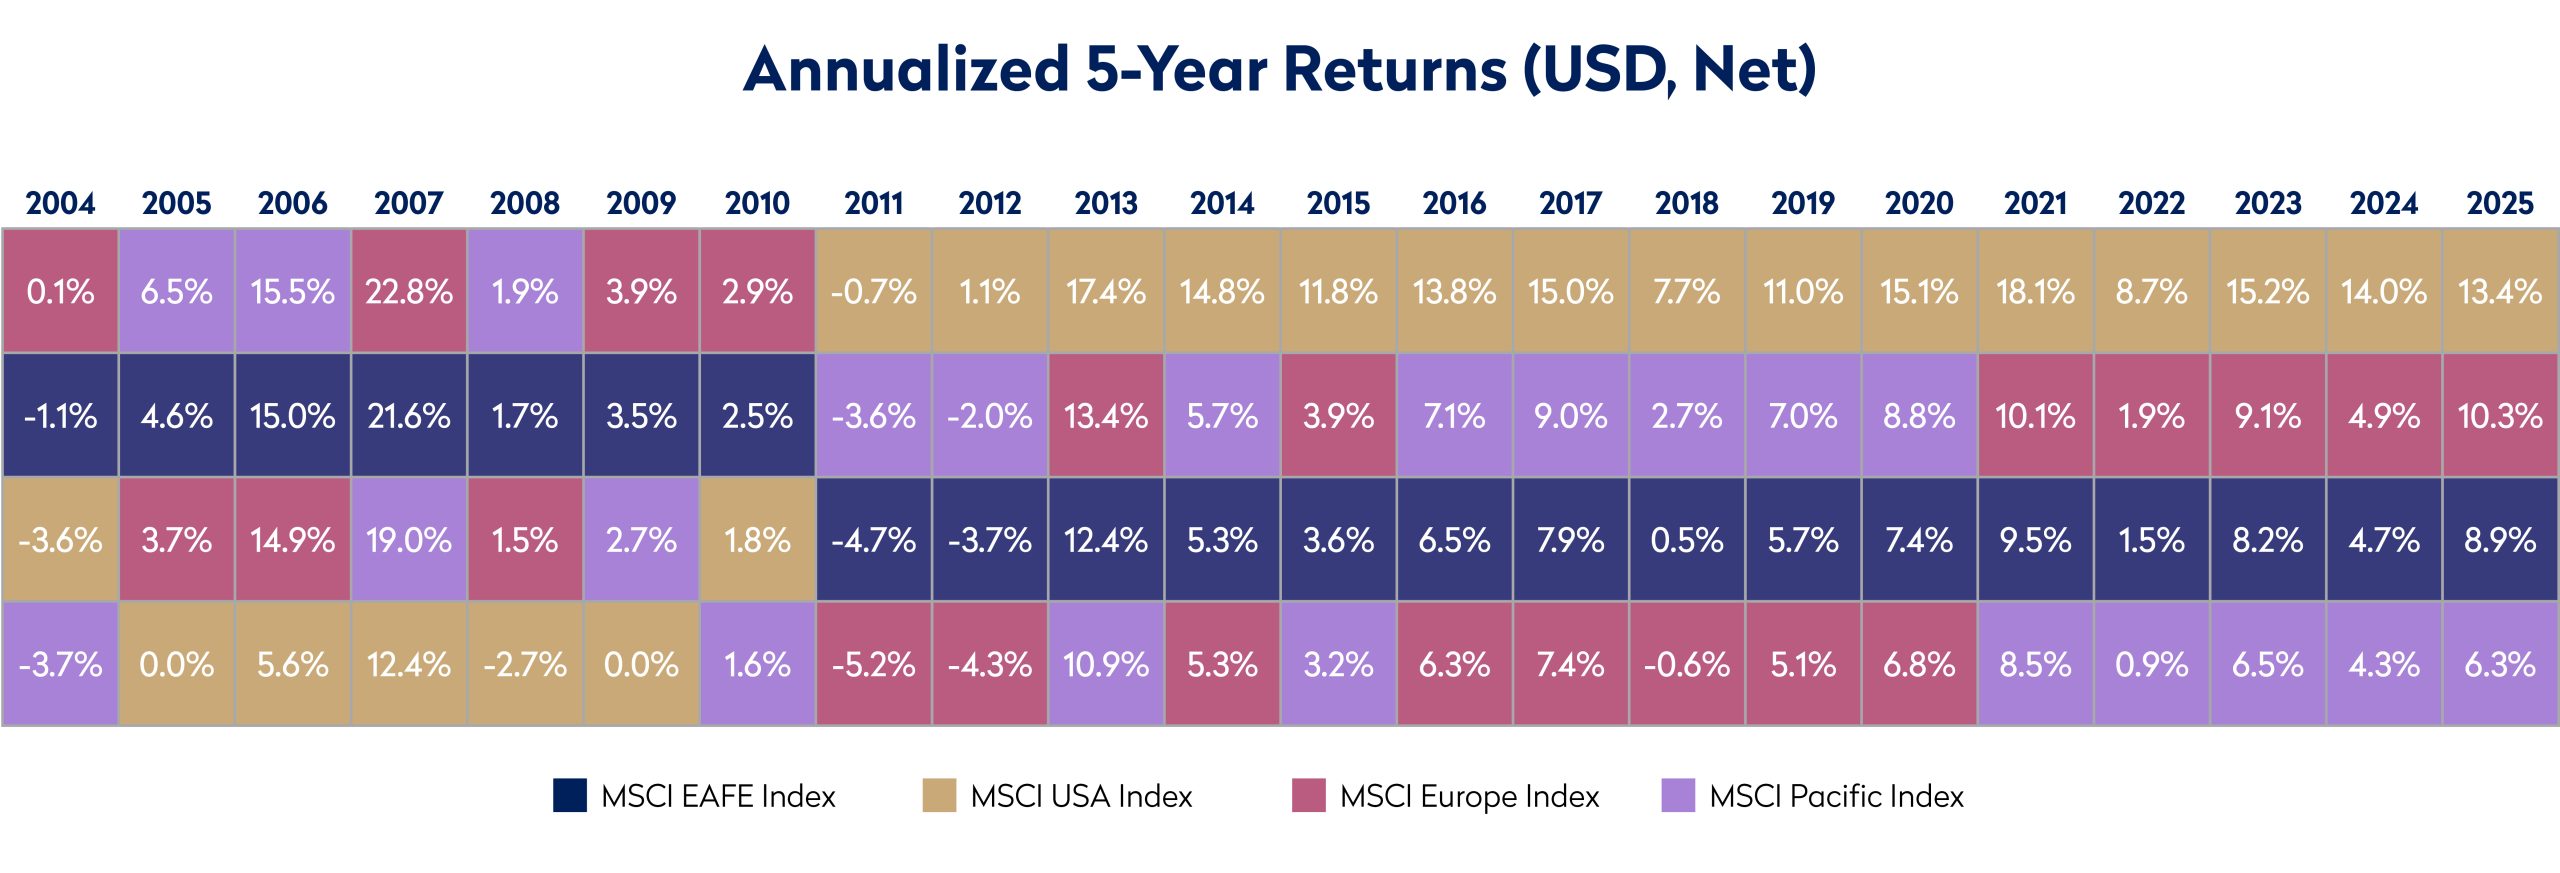
Source: FactSet, MSCI
Today, valuation differentials remain wide, currency misalignments are elevated, and structural reforms are gaining traction across several international markets. In this context, the case for international equities is increasingly compelling. We frame the opportunity around five pillars: attractive valuations, diversification amid US concentration, positioning imbalances, undervalued currencies, and emerging structural catalysts.
Pillar I: Valuations – A Historically Wide Dispersion
The case for international equities begins with attractive valuations. Even after strong performance in 2025, international markets continue to trade at a meaningful discount to US equities on a local currency basis. US equities, however, are priced at historically elevated premiums relative to non-US peers. That premium has been partly justified. Over the past decade, US companies have delivered stronger earnings growth and higher returns on capital, supported by meaningful exposure to innovative technology businesses. However, the magnitude of today’s gap remains notable. Following the recent market surge, US equities trade at approximately a 43% premium to international markets. Even after adjusting for the outsized influence of the largest technology companies, the US market still commands a 21% premium: elevated relative to historical norms.
For long-term allocators, such dispersion creates an opportunity to access durable businesses with global revenue streams at more attractive entry points, improving the prospective risk-reward profile of international allocations.
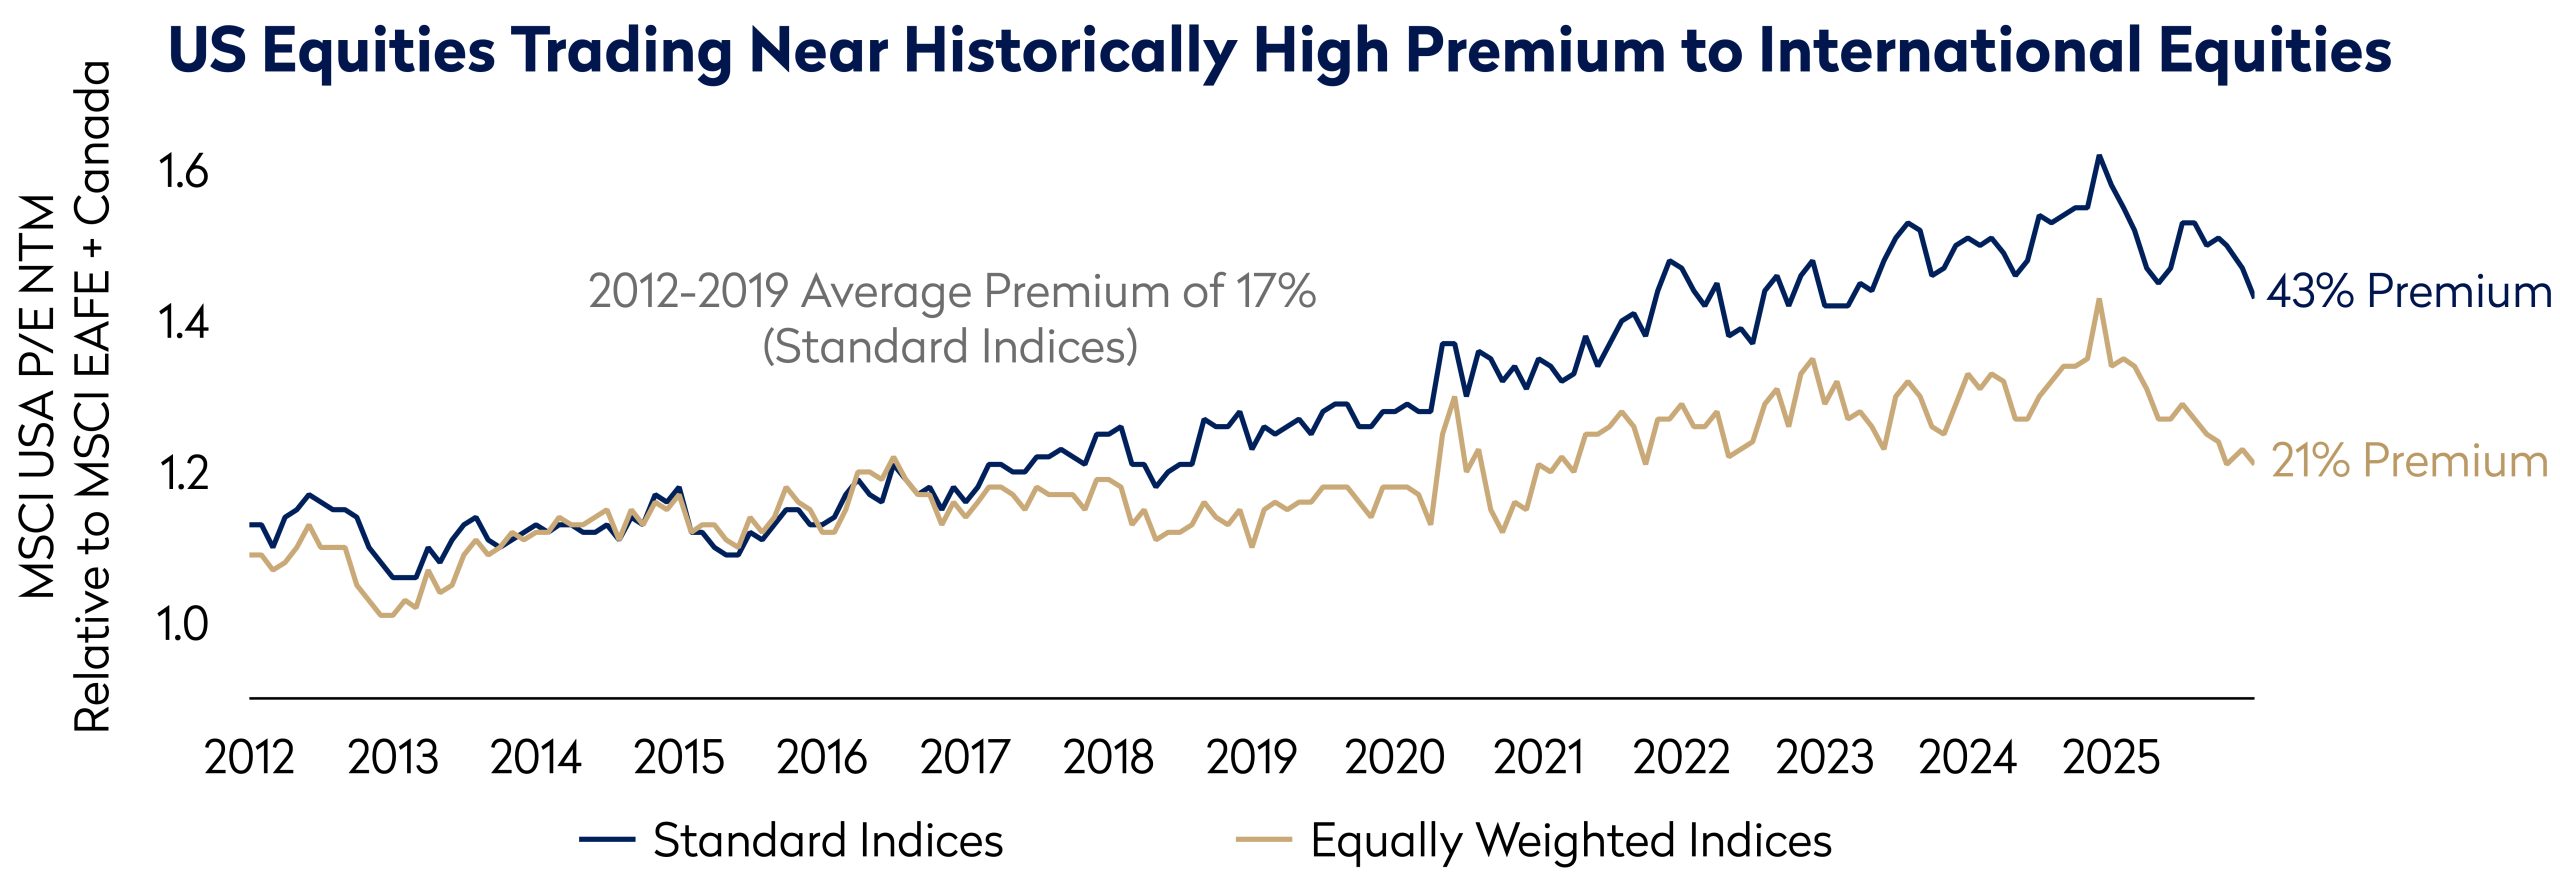
Source: FactSet, MSCI
Data as of December 31, 2025
Pillar II: Diversification – Heightened Concentration Risk in the US market
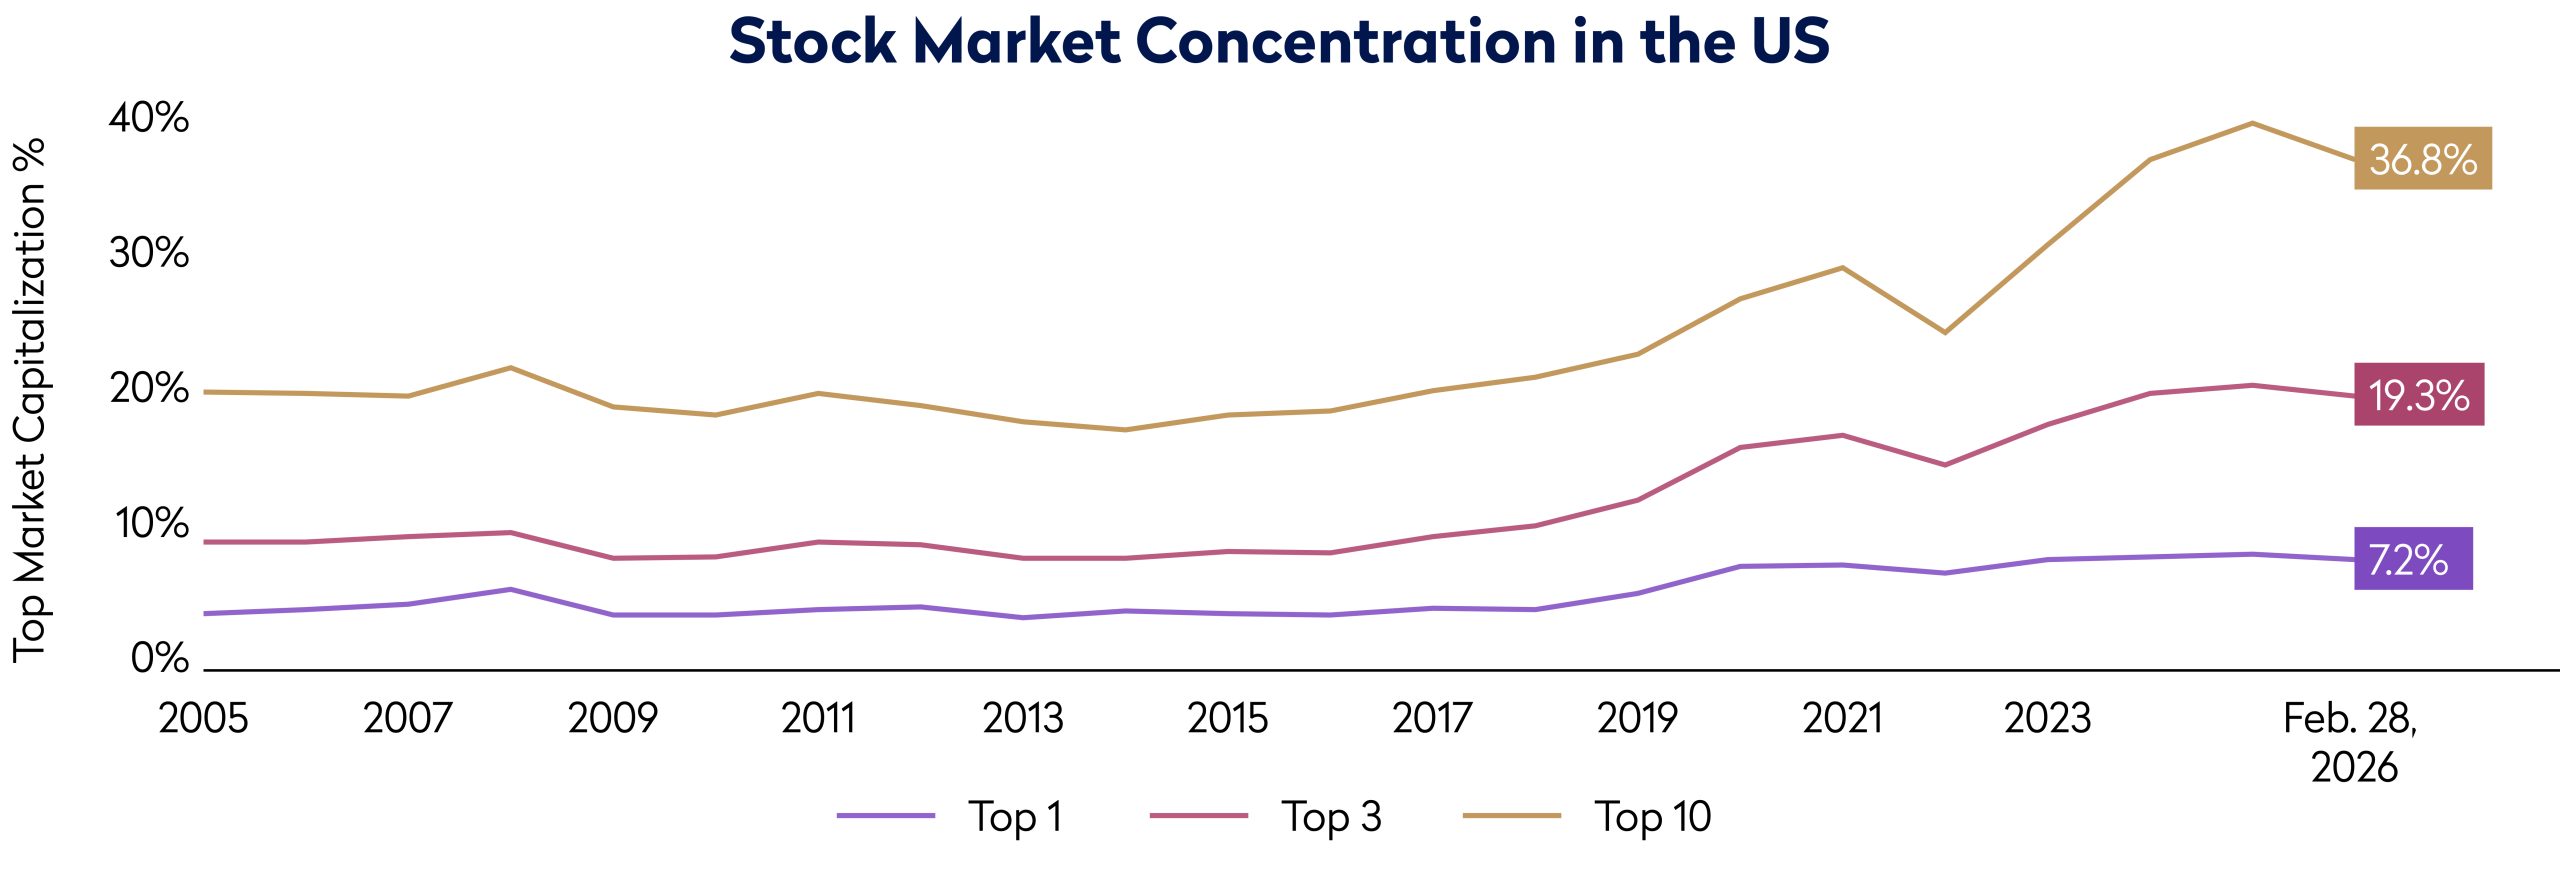
Alongside valuation, portfolio construction considerations reinforce the case for international equities. The US market has become increasingly concentrated, with the largest constituents now representing approximately 37% of total index weight. This concentration increases the sensitivity of overall returns to a small number of stocks and to a narrow set of growth drivers, particularly those linked to the AI theme.

Source: FactSet, IMF and MSCI
Universe includes companies listed in MSCI USA Index
International markets, by contrast, are less concentrated and less correlated to a single structural theme. Sector representation is broader and more balanced, with greater exposure to industrials, financials, healthcare, consumer sectors, and utilities. As a result, international equities provide differentiated return drivers, often at a meaningful valuation discount to US peers.
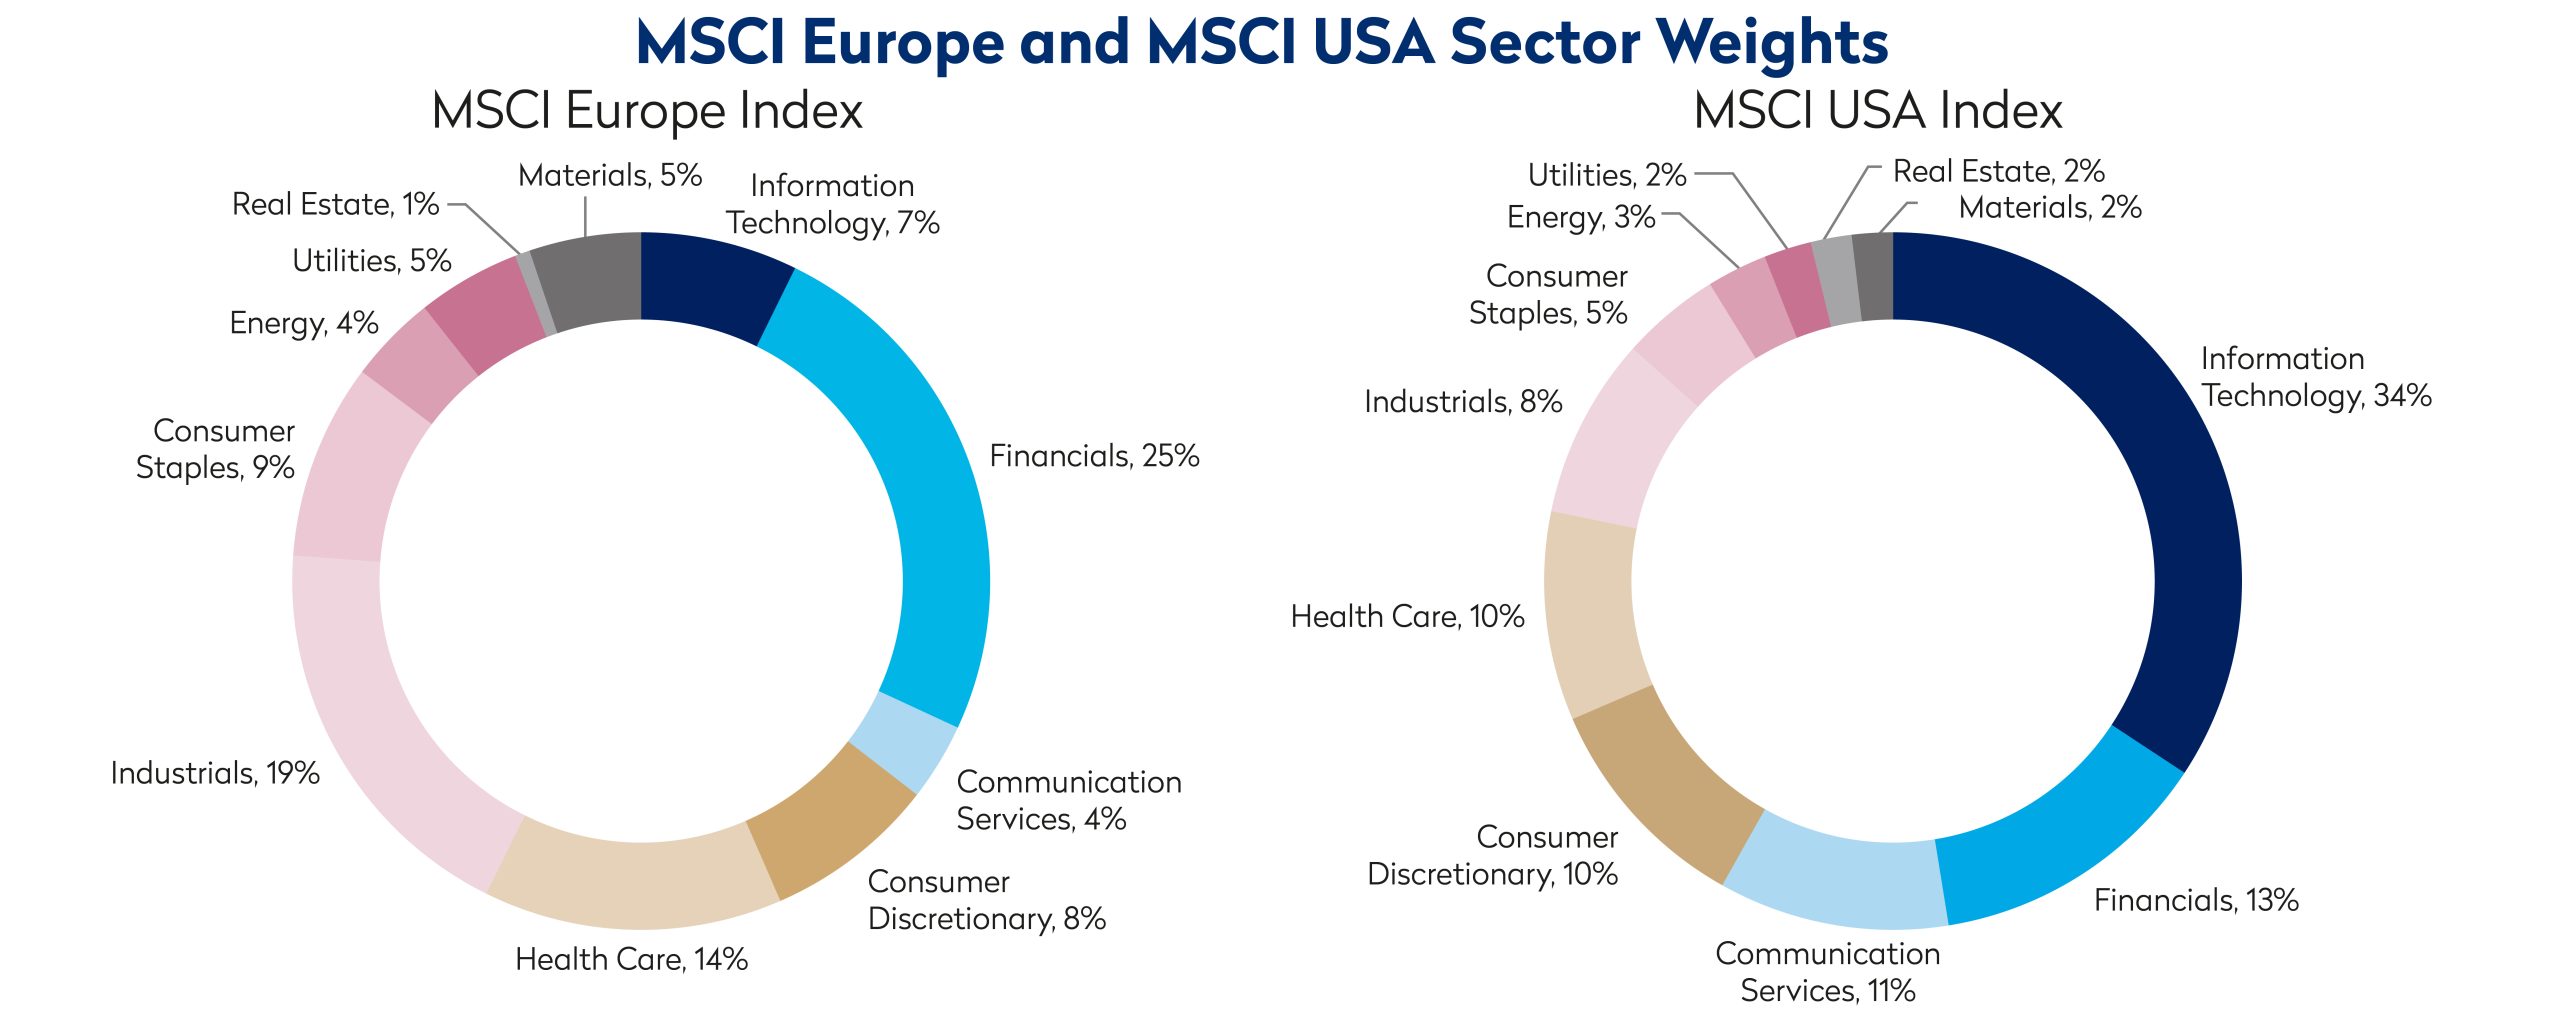
Source: FactSet, MSCI
Data as of December 31, 2025
Moreover, in an increasingly interconnected global economy, revenue exposure is not confined by a company’s listing domicile. Many international companies generate substantial global revenues, offering access to similar end markets as US peers, but within less concentrated indices and at more attractive valuations. International allocation therefore enhances diversification without sacrificing participation in global growth.
Pillar III: Market Concentration vs Economic Reality
The concentration of the US market is mirrored in investor allocations. After more than a decade of sustained outperformance, global equity markets have become heavily weighted towards US securities. The United States represents approximately 26% of global GDP, yet accounts for roughly 74% of the MSCI World Index.
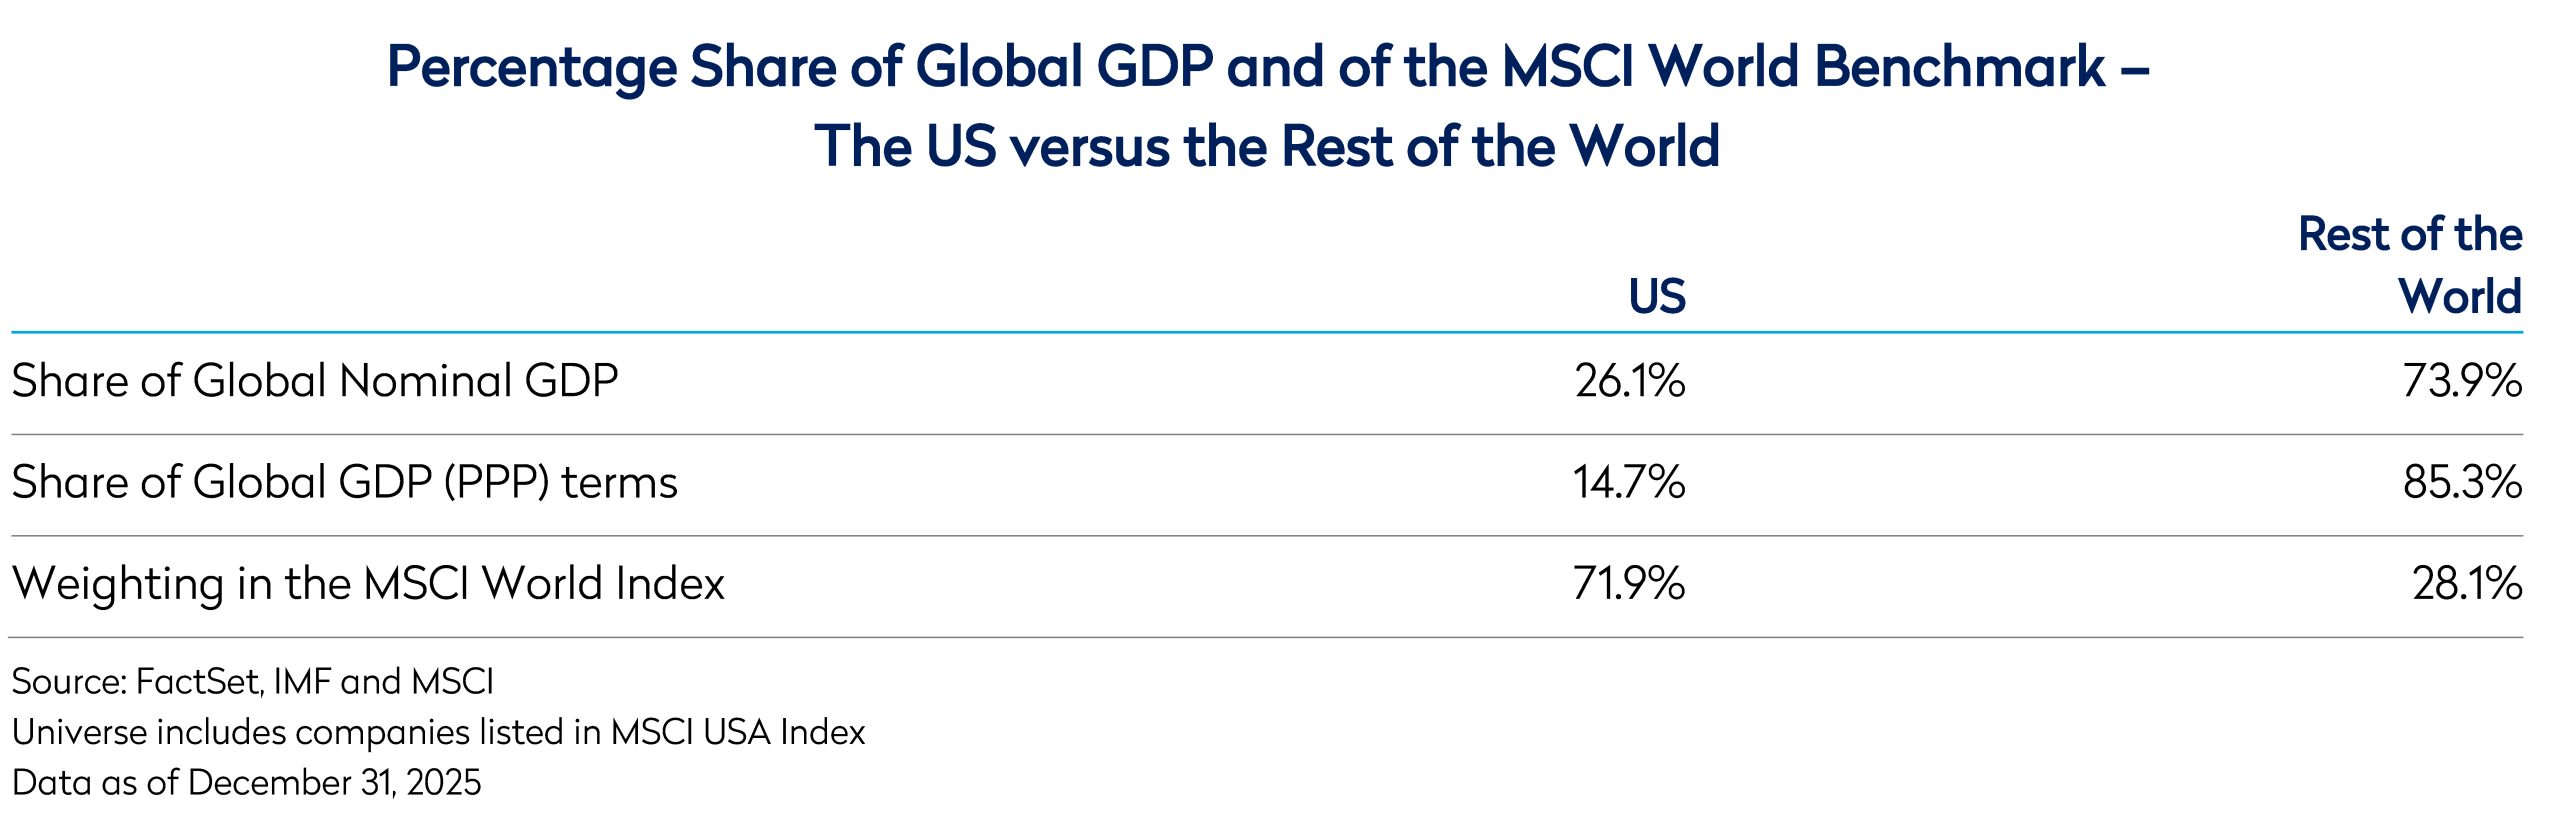
The stark divergence between the US.’s share of global GDP and its weight in global equity indices serves as a useful sense check on market concentration and overall valuation levels. While not a direct measure of valuation, such a disparity may signal elevated expectations embedded in US equities relative to the rest of the world. It underscores the extent to which market capitalisation has outpaced underlying economic share, warranting closer scrutiny of assumptions around growth, profitability, and sustainability.
For long-term allocators, this divergence strengthens the strategic case for reassessing international exposure as a source of differentiated return.
Pillar IV: Currency – A Potential Tailwind
Currency has also been a material driver of relative performance over the past decade. A significant portion of US outperformance versus international markets has coincided with sustained dollar strength, which has amplified domestic returns while suppressing returns for US-based investors in non-US equities.
Using Purchasing Power Parity as a valuation anchor, the dollar remains near historically elevated levels, while international currencies remain undervalued in aggregate despite their recent rebound. Currency cycles have historically moved in multi-year periods, and valuation extremes have tended to mean revert over time.
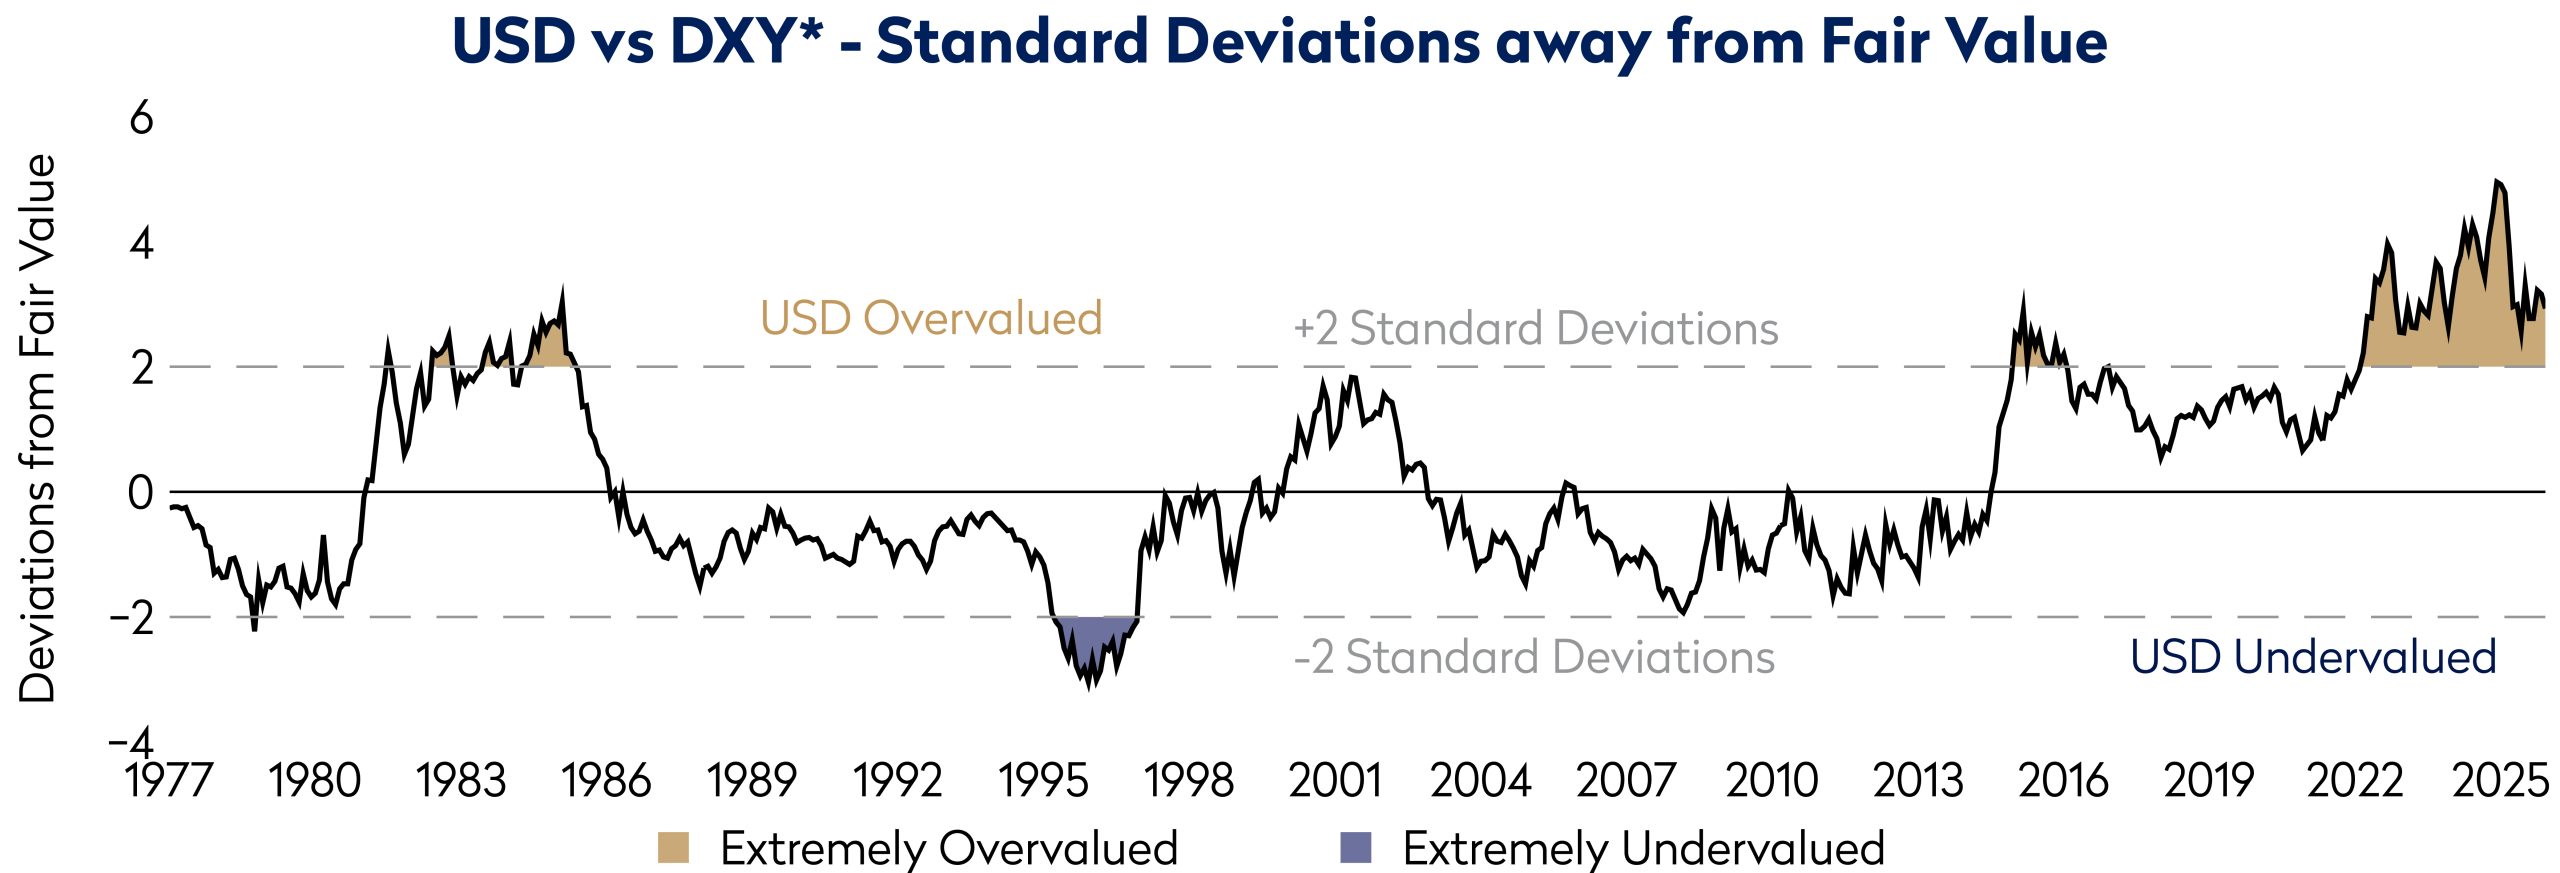
Source: Mondrian
*DXY/US Dollar Index representing a basket of foreign currencies
Data as of December 31, 2025
Several forces suggest the potential for dollar depreciation, including narrowing interest rate differentials, evolving trade and capital flows, and shifting geopolitical dynamics that are encouraging greater diversification of currency exposure. For US investors, a weaker dollar would act as a meaningful tailwind to international equity returns. When combined with discounted local equity valuations, currency provides an additional and often underappreciated source of return potential, reinforcing the case for international equities.
Pillar V: Structural Opportunities Outside of the US
In addition to positioning considerations, international markets are benefiting from structural developments that were either absent or underappreciated in prior years.
In Japan, corporate governance reform continues to drive improved capital efficiency, rising shareholder returns, and a cultural shift toward balance sheet optimization. In Europe, meaningful fiscal stimulus, particularly in Germany, is reshaping the growth outlook through increased investment in infrastructure, defense, and industrial capacity. With comparatively lower debt levels than the US, Germany has balance sheet capacity to support expansion, and the broader region is showing greater coordination in addressing competitiveness and innovation gaps.
Source: FactSet, IMF and MSCI
Data as of December 31, 2025
Across multiple regions, investment linked to the energy transition, supply chain diversification, and domestic industrial policy is supporting sectors such as industrials, utilities, and materials- areas where international markets have greater representation. At the same time, several Asian economies continue to benefit from demographic tailwinds, rising domestic consumption, and evolving manufacturing dynamics.
![]()
Source: MSCI, Regulatory reports, TSO DSO annual reports, Bernstein, IEA and BNEF
Taken together, these factors reflect a broadening and strengthening of the international opportunity set. Improving earnings trajectories, enhanced capital discipline, and supportive policy frameworks suggest that international equities are positioned to generate competitive long-term returns.
Conclusion
The US remains home to many of the world’s most innovative and dynamic companies, and advances in AI may continue to support strong earnings growth among select US companies. Much of that strength, however, is already reflected in elevated valuations and concentrated index weights. By contrast, many non-US markets combine structural growth drivers, improving governance standards, undervalued currencies, and attractive valuations.
For long-term investors, the question is not whether the US will continue to produce world-class companies, but whether current relative pricing and portfolio concentration appropriately reflect the breadth of global opportunity. In an interconnected world, investors can often access similar end markets or geographical exposures irrespective of where companies are listed. When valuation dispersion is wide, expanding international exposure can enhance diversification and improve prospective risk-adjusted returns.
At Mondrian, our investment philosophy is grounded in intrinsic value, rigorous bottom-up research, and disciplined currency analysis. In today’s environment of elevated dispersion and valuation levels, we believe the strategic case for increasing international equity exposure is compelling.
Disclosures
Views expressed were current as of the date indicated, are subject to change, and may not reflect current views. All information is subject to change without notice. Views should not be considered a recommendation to buy, hold or sell any investment and should not be relied on as research or advice.
This document may include forward-looking statements. All statements other than statements of historical facts are forward-looking statements (including words such as “believe,” “estimate,” “anticipate,” “may,” “will,” “should,” “expect”). Although we believe that the expectations reflected in such forward-looking statements are reasonable, we can give no assurance that such expectations will prove to be correct. Various factors could cause actual results to differ materially from those reflected in such forward-looking statements.
Neither MSCI nor any other party involved in or related to compiling, computing or creating the MSCI data makes any express or implied warranties or representations with respect to such data (or the results to be obtained by the use thereof), and all such parties hereby expressly disclaim all warranties of originality, accuracy, completeness, merchantability or fitness for a particular purpose with respect to any of such data. Without limiting any of the foregoing, in no event shall MSCI, any of its affiliates or any third party involved in or related to compiling, computing, or creating the data have any liability for any direct, indirect, special, punitive, consequential or any other damages (including lost profits) even if notified of the possibility of such damages. No further distribution or dissemination of the MSCI data is permitted without MSCI’s express written consent.
This material is for informational purposes only and is not an offer or solicitation with respect to any securities. Any offer of securities can only be made by written offering materials. The information set forth herein is a summary only and does not set forth all of the risks associated with the investment strategy described herein.
The information was obtained from sources we believe to be reliable, but its accuracy is not guaranteed, and it may be incomplete or condensed.
It should not be assumed that investments made in the future will be profitable or will equal the performance of any security referenced in this document. Examples of securities will represent only a small part of the overall portfolio and are used to illustrate our investment approach. Any holdings are subject to change and may not feature in any future portfolio. More information on holdings is available on request.
Unless otherwise stated, all returns are in USD.
All references to index returns assume the reinvestment of dividends after the deduction of withholding tax and approximate the minimum possible re-investment, unless the index is specifically described as a “Gross” index
Past performance is not a guarantee of future results. An investment involves the risk of loss. The investment return and value of investments will fluctuate.
Mondrian Investment Partners Limited is authorised and regulated by the Financial Conduct Authority (Firm Reference Number: 149507). Mondrian Investment Partners Limited is also registered as an Investment Adviser with the Securities and Exchange Commission (registration does not imply any level of skills or training).