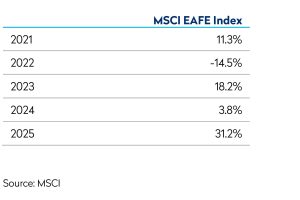

Market Strength Is Narrowing Around a Small Number of AI-Related Winners
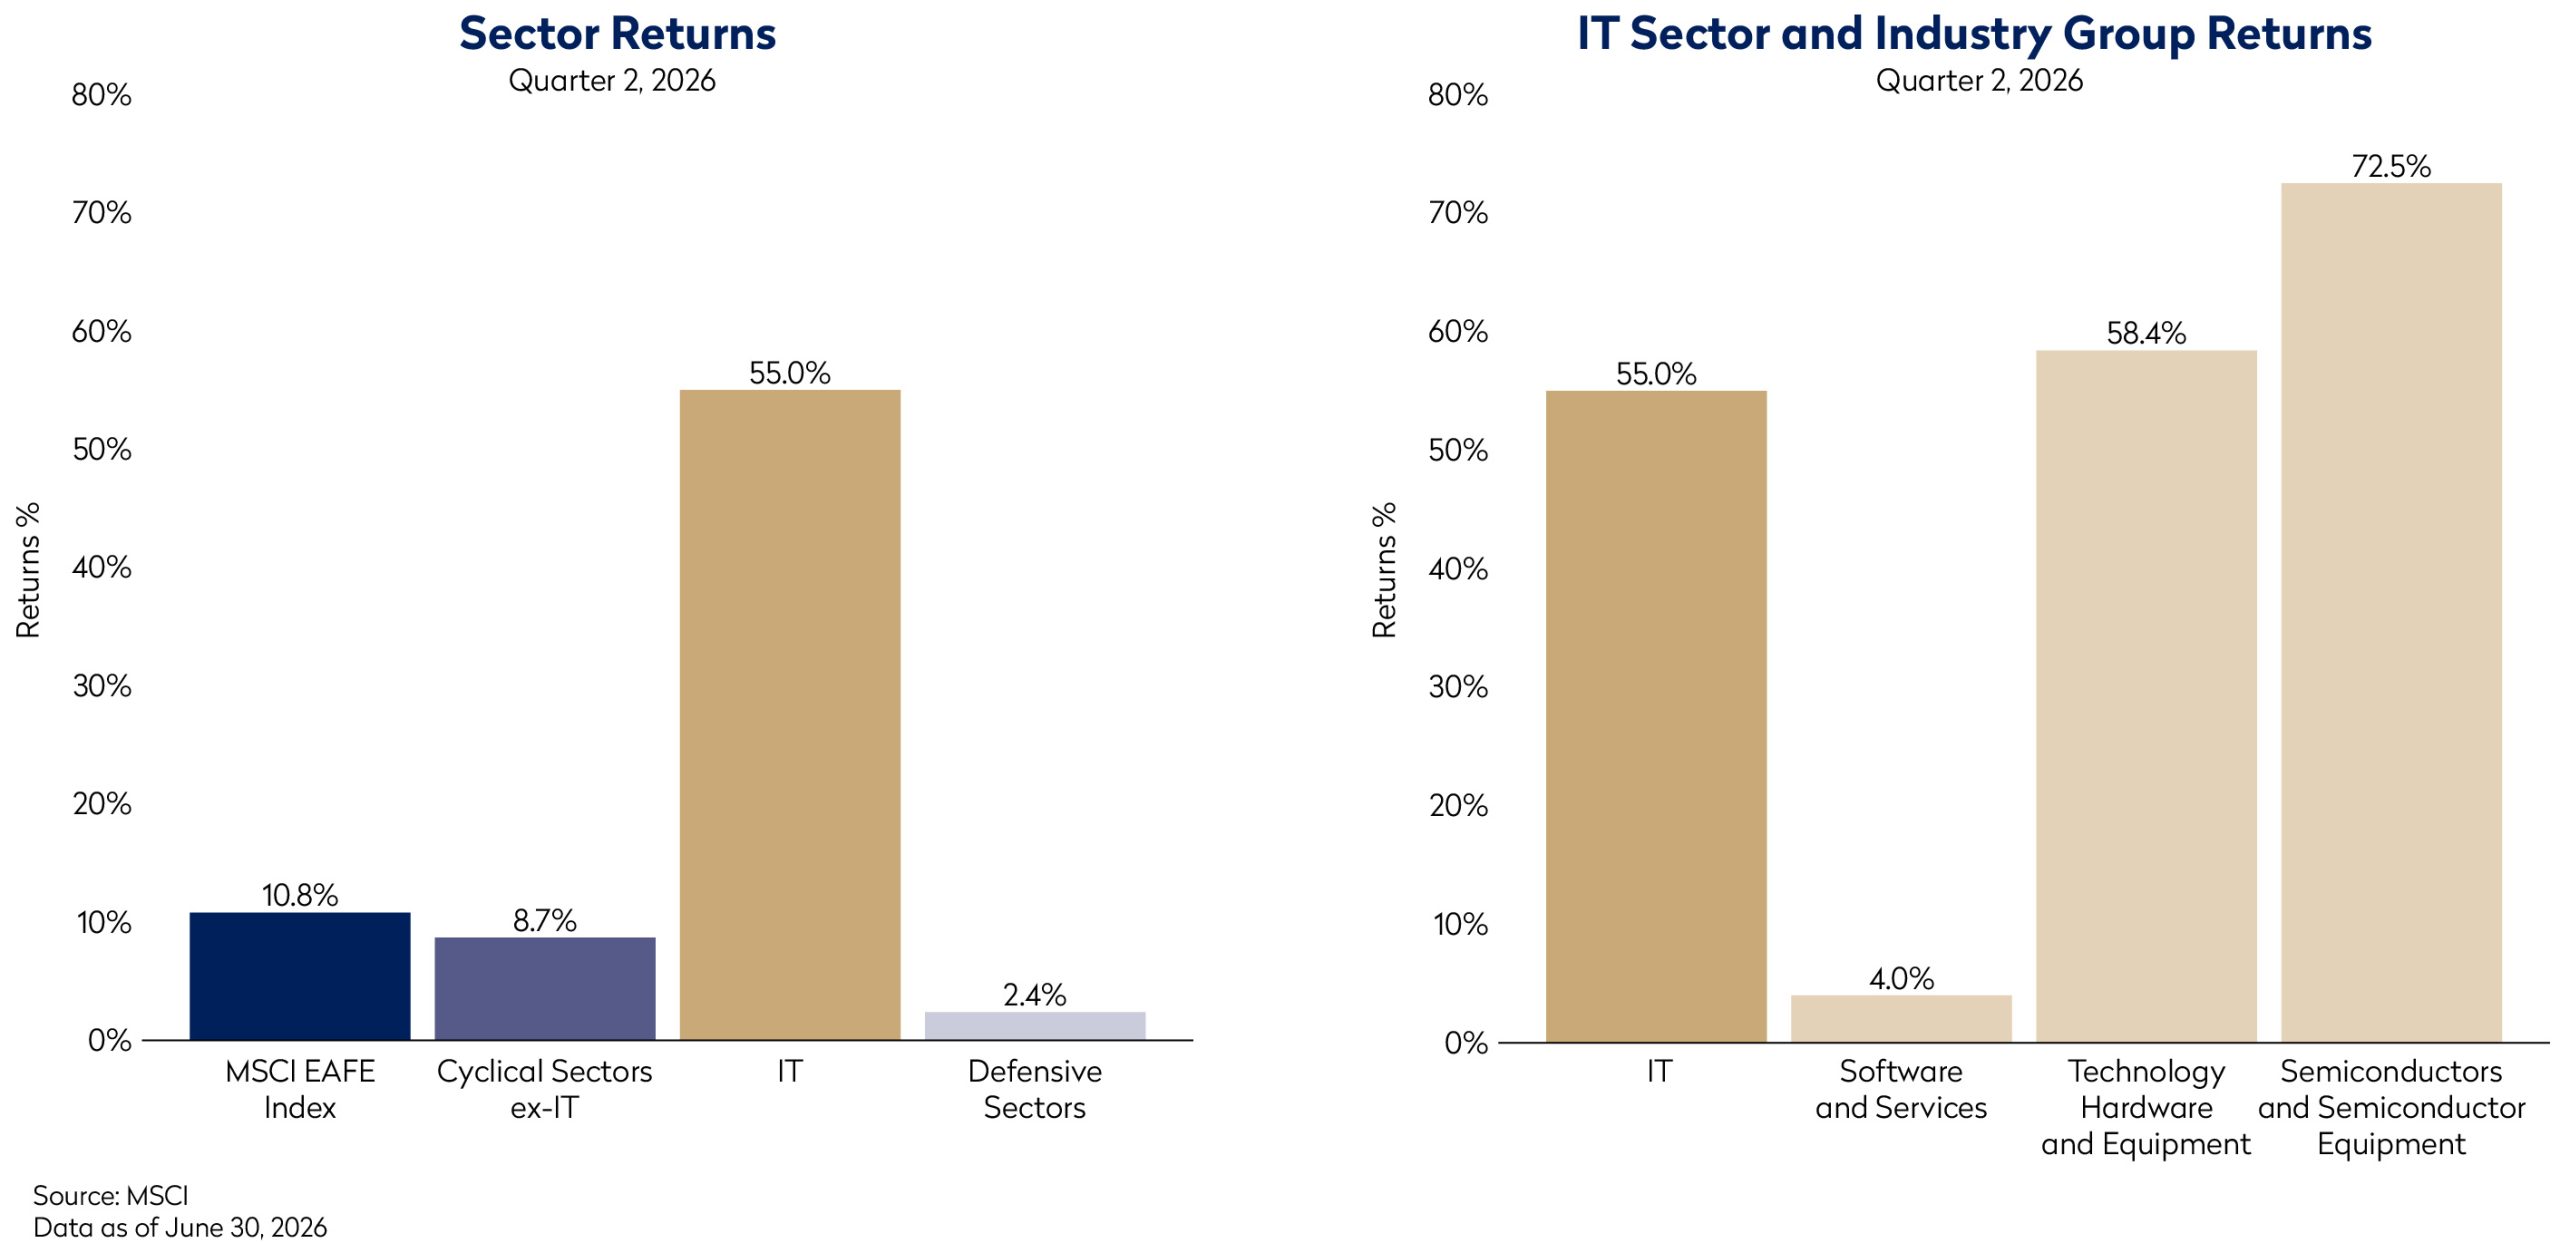
Global markets staged an impressive recovery in the second quarter, despite the unanswered questions surrounding the longer-term impacts of the conflict in the Middle East on commodity prices and inflation. Rather than illustrating broad market resilience, this rebound has been propelled by a limited number of AI-related stocks, following upbeat forecasts from a handful of global chipmakers and hyperscalers that reaffirmed the durability of the spending cycle around artificial intelligence. This quarter’s market advance has been unusually narrow, prompting increased concerns around the concentration of market leadership and the outlook for global equities if sentiment towards these AI-linked names reverses.
The AI Buildout: Scaling Opportunity, Scaling Risk
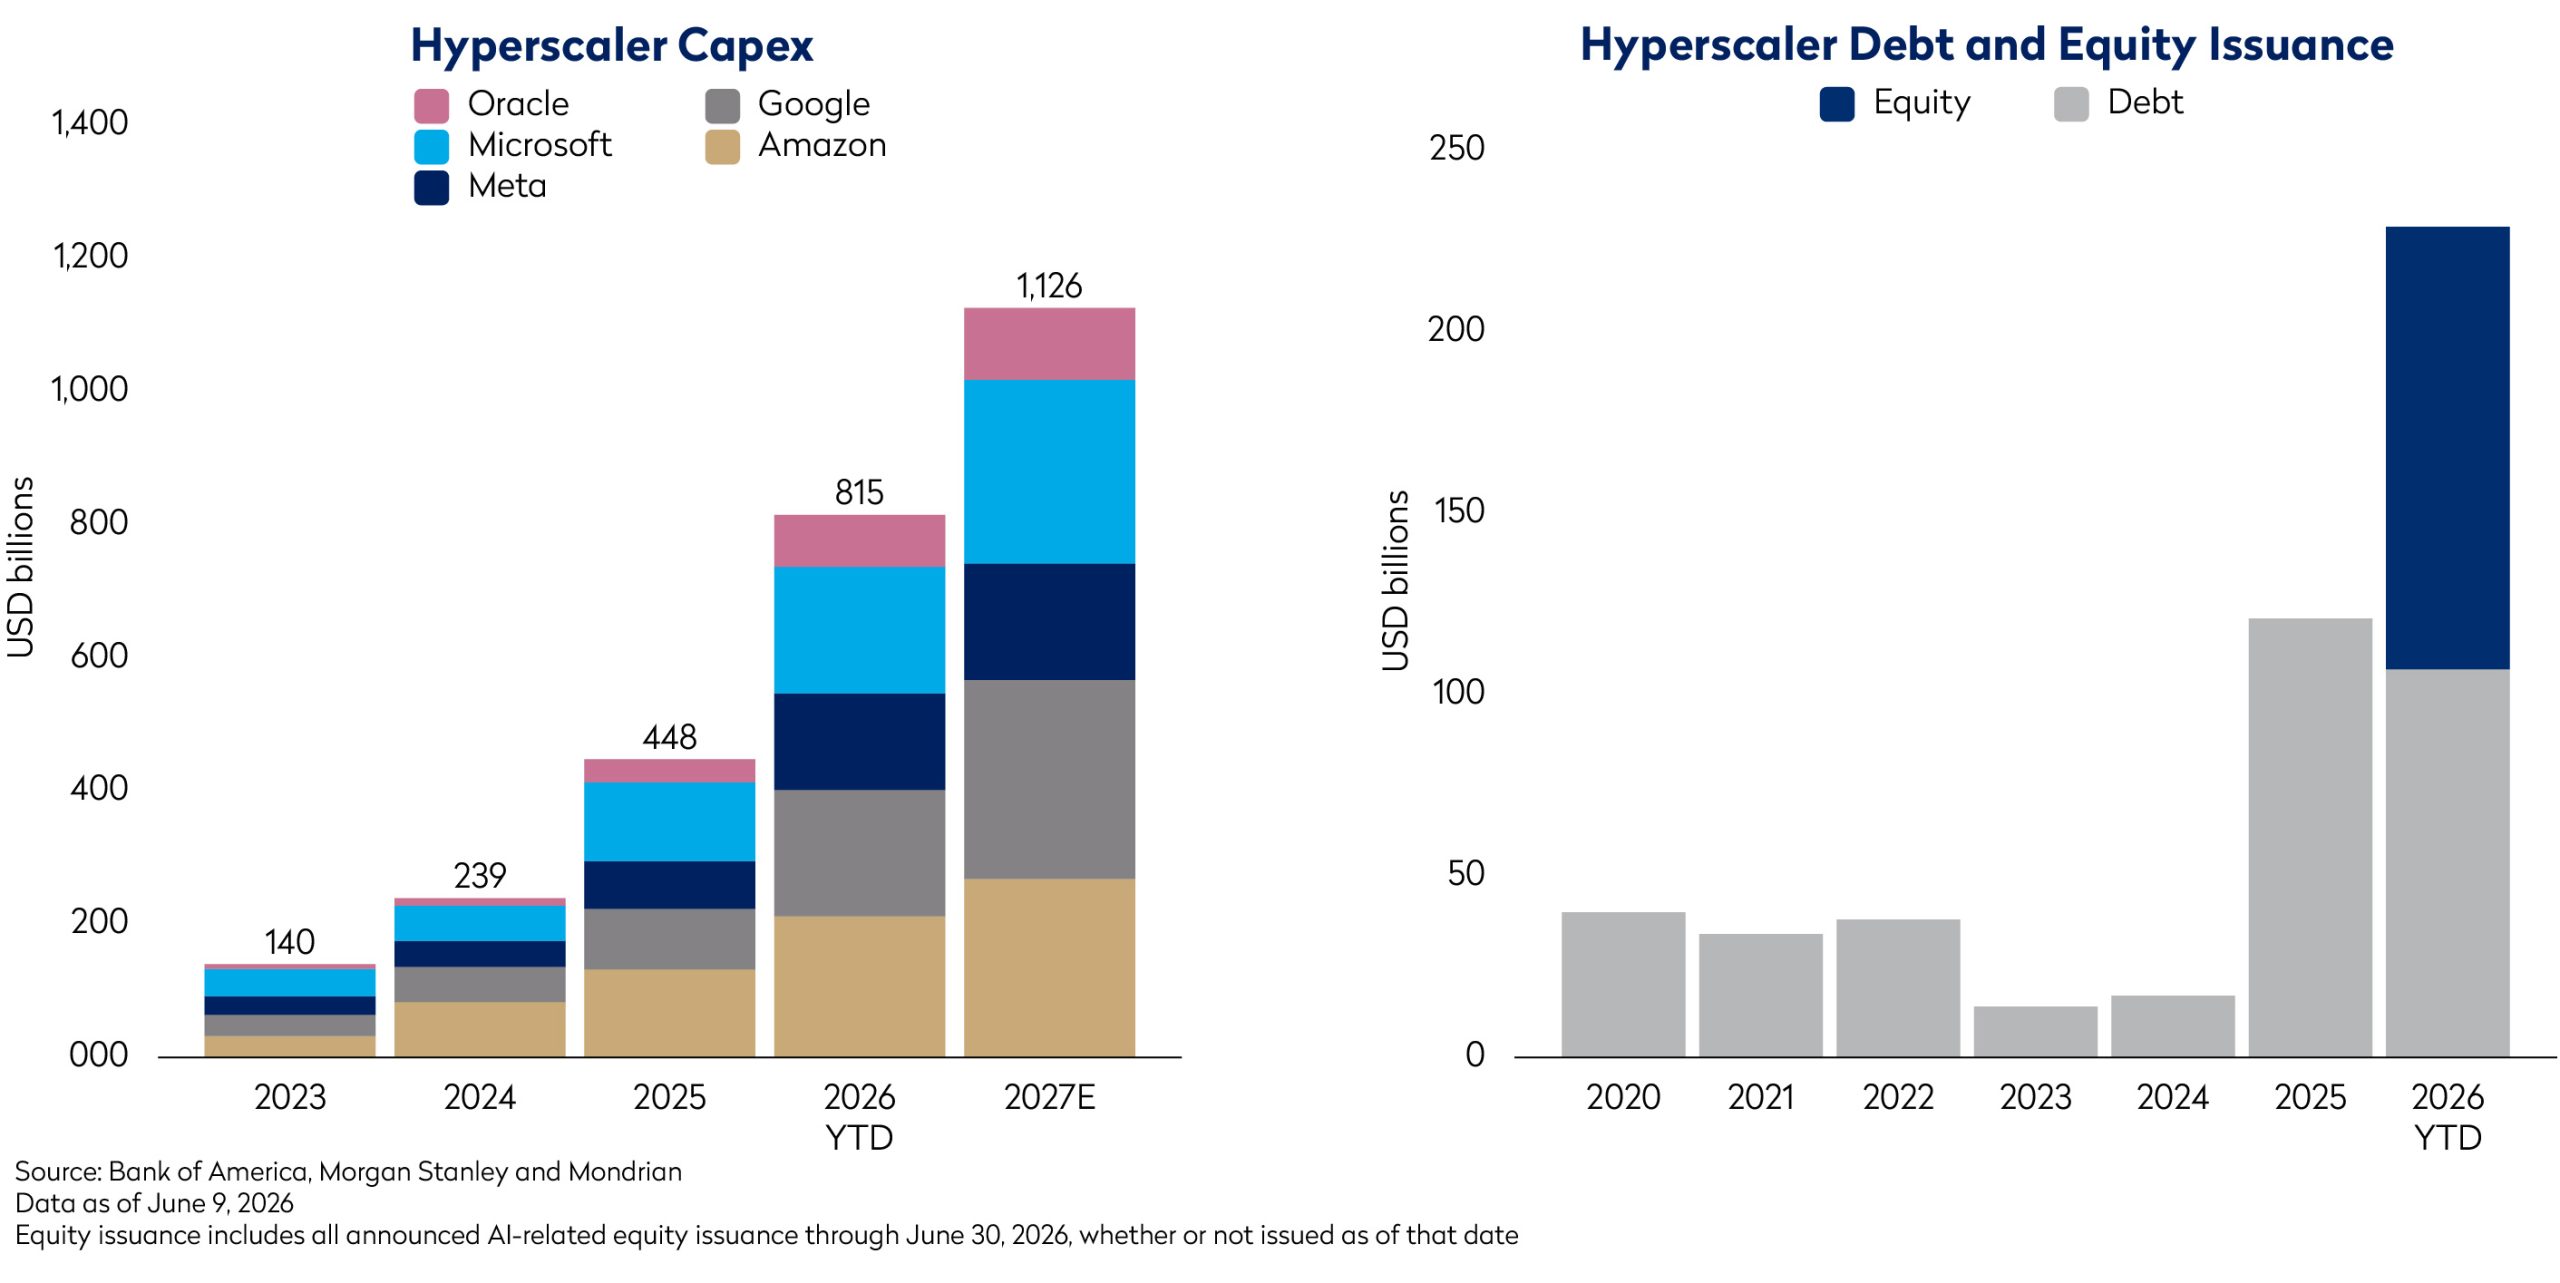
While the nature of the debate around artificial intelligence did not change in the quarter, its scale has. Hyperscale capex continues to grow, and the investments made two years ago have, in many cases, clearly paid off. They have supported not just cloud computing growth, but also the core businesses of the hyperscalers in areas such as search and advertising. However, the scale of investment is now pushing their balance sheet and free cash flow capacity to its limits.
When AI investments were solely being funded from the free cash flow of highly profitable hyperscalers, companies could sustain spending through periods of volatility. Now that investments are increasingly supported by debt and equity markets, the cycle is more sensitive to investor confidence, credit conditions, and valuation multiples. Alphabet’s recent $80bn equity raise is a useful example of both sides of this shift.1 For less than 2% share count dilution, the company can effectively raise enough cash to increase next year’s capex budget by around 40%, showing how much further the AI infrastructure buildout could extend if equity markets remain open. But that same dynamic also adds fragility to future growth as the scale and duration of investment become increasingly dependent on the market’s appetite for funding.
This creates a more complex problem for long-term investors. The compute market is currently extremely tight, supporting short-term earnings momentum across the full supply chain, including semiconductors, networking, data centres, power equipment, and cloud infrastructure. However, supply shortages are not a permanent feature of any industry. The key distinction for us is between being structurally bullish on AI – believing that adoption and investment will continue to expand over the long term – and being cyclically cautious on how that optimism is currently reflected in equity markets.
To date, the strongest returns have accrued to semiconductors companies, where scarcity pricing, aggressive customer pre-orders and unprecedented capital spending have lifted both earnings and expectations. As the absolute dollars flowing into AI continue to increase, maintaining the same rate of year-over-year growth becomes mathematically more difficult. Yet many of the leading beneficiaries are priced as though extraordinary growth rates can persist for an extended period.
The risk is that incremental capacity begins to catch up just as growth rates moderate, and advances in workload routing and inference efficiency start to reduce compute intensity. AI adoption can continue to expand rapidly while growth in infrastructure spending decelerates. But if today’s investment levels have been underwritten by unusually favourable industry conditions, the current semiconductor profit pool may prove to be unsustainable.
AI-Related Investment Edges Past the Dot-Com Boom
AI investment is becoming an important driver of broader economic growth. The scale of spending on data centres, semiconductors, power infrastructure, networking equipment, and cloud capacity has grown large enough to have macroeconomic relevance, particularly in the US. Real GDP there grew at a 2.1% seasonally adjusted annual rate in the first quarter of 2026, according to the US Bureau of Economic Analysis, led by a sharp increase in investment categories tied closely to AI. Overall business investment increased at a 10.6% annual rate in the quarter.2 This investment has supported corporate earnings, industrial activity, construction demand and employment in parts of the economy linked to the compute supply chain.
However, the sheer scale of AI investment may also be masking a more modest underlying growth picture. Has strong AI performance made the economy look healthier – and made equity markets broader – than either really is? In the US, real disposable income growth softened in the quarter, while job growth was surprisingly weak for an economy supposedly expanding at a solid pace. Consumer spending remains robust but has been supported by a decline in the savings rate, most likely reflecting a wealth effect from a strong equity market. So long as AI spending continues to accelerate, it may sustain the appearance of broad-based resilience. If it slows, the effect could be felt well beyond the technology sector.
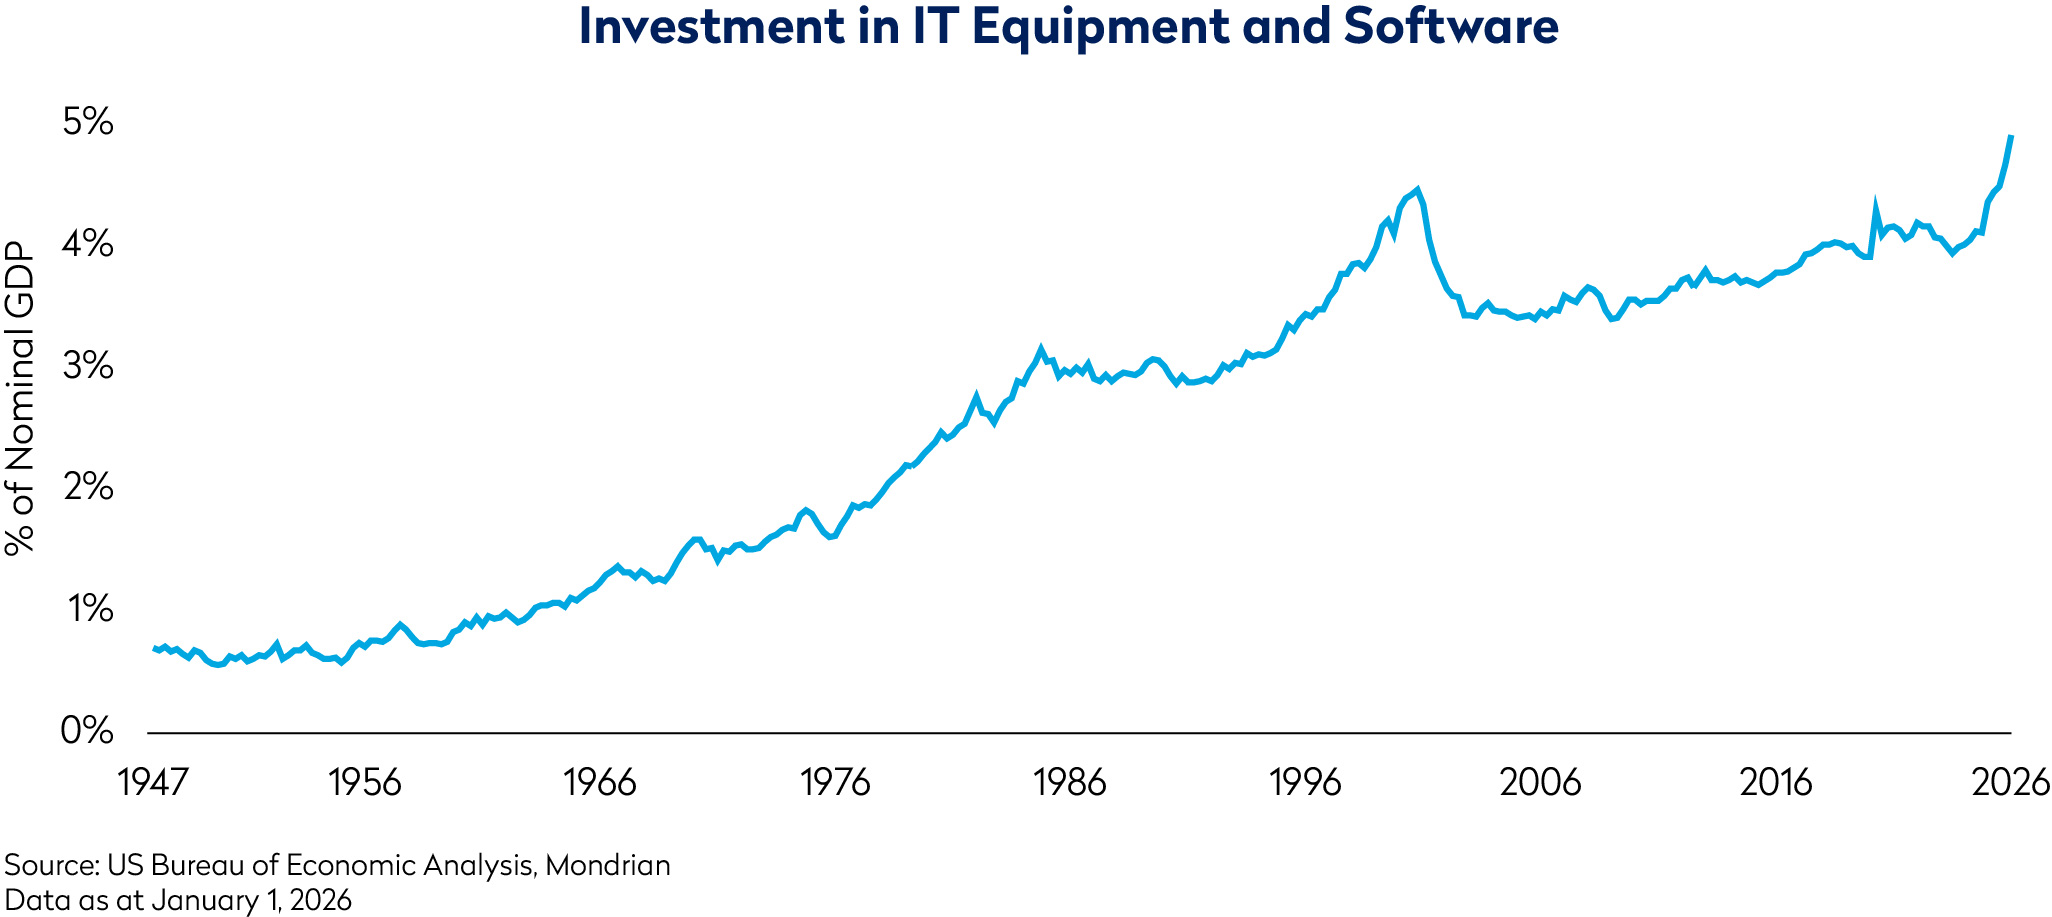
The current AI buildout has some parallels with prior technology investment cycles, including that of the late 1990s. During the dot-com period, investment in telecoms, networking, and internet infrastructure became an important contributor to growth: in 2000, IT-related investments drove more than 80bps of US real GDP growth of 2.9%. Overcapacity and falling returns then led to a sharp retrenchment in IT equipment and software investment as a share of GDP, a level only recently surpassed (see the chart below). The analogy should not be overstated, however. Today’s leading companies are generally far more profitable and better capitalized than many at the peak of the dot-com cycle.
The early 2000s was also a more speculative period, characterised by hundreds of small companies with unproven business models and little prospect of meaningful sales or profits. Barriers to entry were low, reflecting the capital-light nature of websites. Today, by contrast, the demand signal from AI is clear, and it is that demand that is pulling supply investment forward. AI is hugely capital intensive and estimates of the ultimate scale of the AI build-out are enormous. These expenditures have the potential to act as an economic stimulus for a long period. Investment is required all the way down the supply chain, and includes infrastructure for power, cooling, compute, network, storage and security operations.
Nonetheless, once a fast-growing investment cycle becomes large enough to drive the wider economy, any deceleration will have second-order effects on growth, employment, confidence, and capital markets. For all the excitement surrounding the race to scale AI, overinvestment has been the hallmark of almost every new technology cycle.
Equity Market Concentration is at All-Time Highs
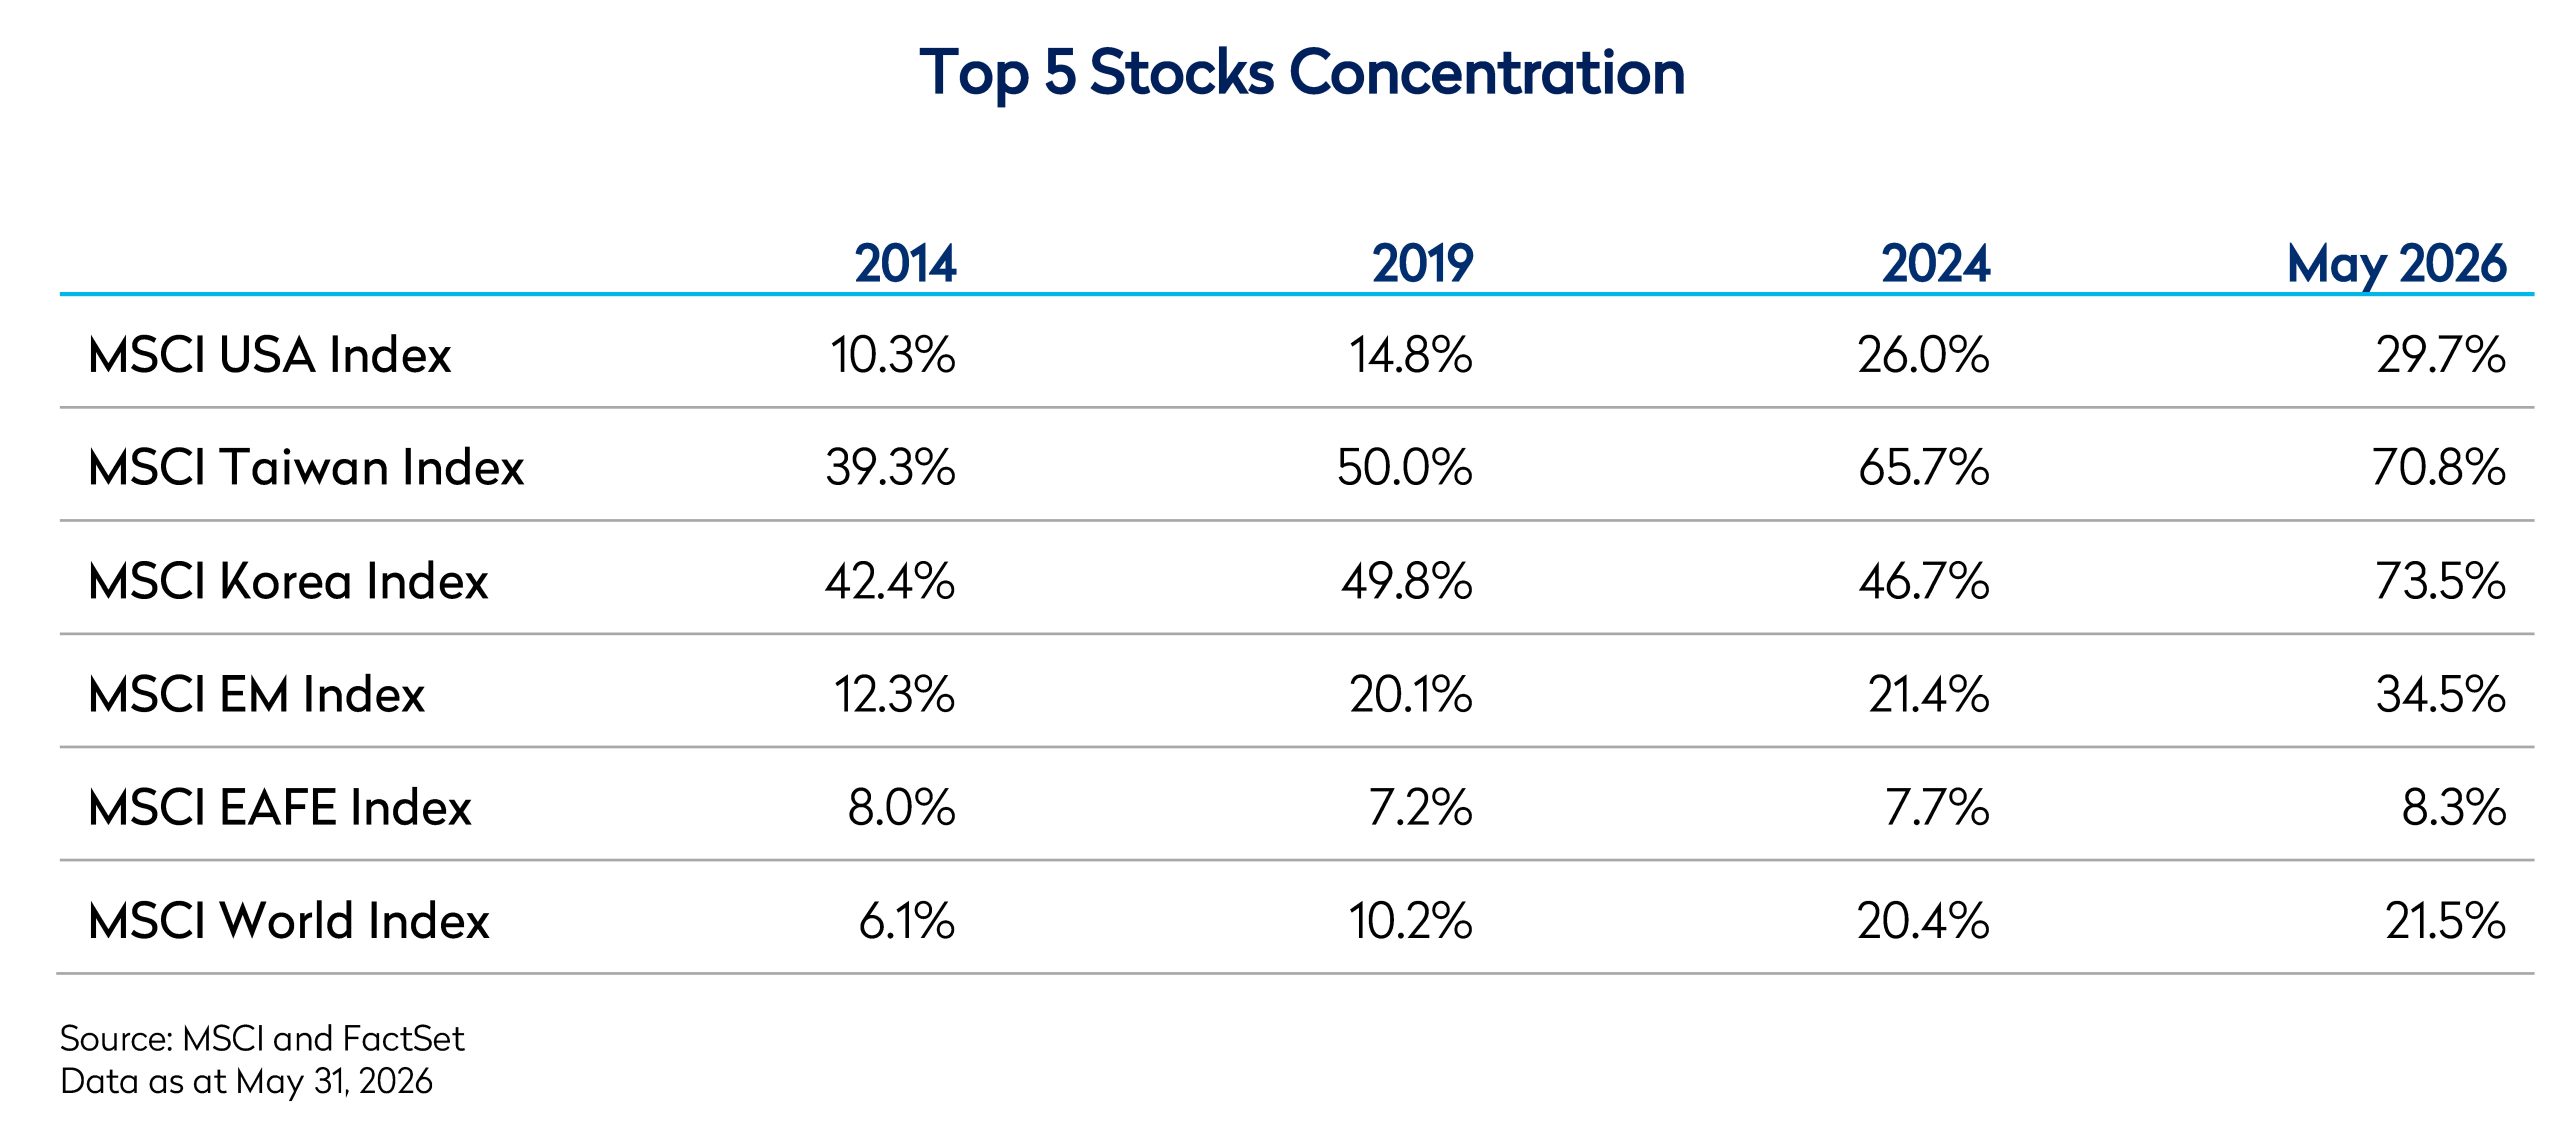
Market concentration adds to this fragility. Equity markets are now unusually dependent on a small number of very large companies, many directly exposed to the AI investment cycle. This concentration has worked in investors’ favour while earnings momentum, investor confidence, and AI-related expectations have moved in the same direction. But it leaves markets more vulnerable if those expectations are revised lower. When returns depend so heavily on a narrow group of stocks, a correction in those names can have an outsized effect on headline market performance. For long-term, disciplined investors such as Mondrian, what matters are fundamental valuations, diversification and the balance between risk and return. Historically, this has supported both upside capture and downside protection – an outcome that depends on understanding the range and skew of potential outcomes for any investment. That range now looks unusually wide for a select group of names globally: semiconductor companies, power infrastructure stocks and other “picks and shovels” plays integral to AI investment spending.
More broadly, the extreme optimism around AI capital expenditure has materially distorted index composition globally. Both US and select Emerging Market indices are now skewed by the concentration and sheer size of their top five companies. Meanwhile, MSCI World is more balanced than the US and EM indices, while MSCI EAFE stands out as the most balanced opportunity set across the major benchmarks.
Conclusion
This quarter’s market advance has been remarkably narrow, concentrated in a small number of technology focused stocks — a marked contrast to the rally at the start of 2026, which saw a notable broadening of returns. We continue to monitor developments in AI-related stocks closely, recognising that the range of outcomes remains very wide, with questions growing about how AI will reshape the global economy.
The extreme movements in the second quarter of 2026 have further widened the dispersion of returns across markets. While a number of AI winners have outperformed strongly, other names have lagged through the churn, opening up very attractive opportunities elsewhere – in many cases, high-ROIC businesses which have historically been too expensive for a value manager like Mondrian. Economic disruption stemming from AI investment could well generate periods of significant market volatility in the coming years. AI investment continues to accelerate and has become a major driver of corporate earnings, economic growth and equity market performance. While the long-term outlook for AI remains compelling, the increasing reliance on external financing, elevated valuations and unprecedented market concentration suggest investors should distinguish between AI’s structural opportunity and the cyclical risks embedded in current expectations.
We are long-term investors and can look through regional and sectoral concentrations to identify what we believe to be the best risk-adjusted opportunities across the globe. Our focus remains on identifying mispriced securities through the application of our DDM methodology, using scenario analysis to deliver strong alpha potential alongside defensive characteristics and a low risk profile.
Disclosures
¹ Alphabet Press Release, 1 June 2026
² US Bureau of Economic Analysis
Views expressed were current as of the date indicated, are subject to change, and may not reflect current views. All information is subject to change without notice. Views should not be considered a recommendation to buy, hold or sell any investment and should not be relied on as research or advice.
This document may include forward-looking statements. All statements other than statements of historical facts are forward-looking statements (including words such as “believe,” “estimate,” “anticipate,” “may,” “will,” “should,” “expect”). Although we believe that the expectations reflected in such forward-looking statements are reasonable, we can give no assurance that such expectations will prove to be correct. Various factors could cause actual results to differ materially from those reflected in such forward-looking statements.
Neither MSCI nor any other party involved in or related to compiling, computing or creating the MSCI data makes any express or implied warranties or representations with respect to such data (or the results to be obtained by the use thereof), and all such parties hereby expressly disclaim all warranties of originality, accuracy, completeness, merchantability or fitness for a particular purpose with respect to any of such data. Without limiting any of the foregoing, in no event shall MSCI, any of its affiliates or any third party involved in or related to compiling, computing, or creating the data have any liability for any direct, indirect, special, punitive, consequential or any other damages (including lost profits) even if notified of the possibility of such damages. No further distribution or dissemination of the MSCI data is permitted without MSCI’s express written consent.
This material is for informational purposes only and is not an offer or solicitation with respect to any securities. Any offer of securities can only be made by written offering materials. The information set forth herein is a summary only and does not set forth all of the risks associated with the investment strategy described herein.
The information was obtained from sources we believe to be reliable, but its accuracy is not guaranteed, and it may be incomplete or condensed.
It should not be assumed that investments made in the future will be profitable or will equal the performance of any security referenced in this document. Examples of securities will represent only a small part of the overall portfolio and are used to illustrate our investment approach. Any holdings are subject to change and may not feature in any future portfolio. More information on holdings is available on request.
Unless otherwise stated, all returns are total returns in USD.
All references to index returns assume the reinvestment of dividends after the deduction of withholding tax and approximate the minimum possible re-investment, unless the index is specifically described as a “Gross” index.
Past performance is not a guarantee of future results. An investment involves the risk of loss. The investment return and value of investments will fluctuate.
Mondrian Investment Partners Limited is authorized and regulated by the Financial Conduct Authority (Firm Reference Number: 149507). Mondrian Investment Partners Limited is also registered as an Investment Adviser with the Securities and Exchange Commission (registration does not imply any level of skills or training).