
Broad Impact of the Iran War on Global Emerging Markets
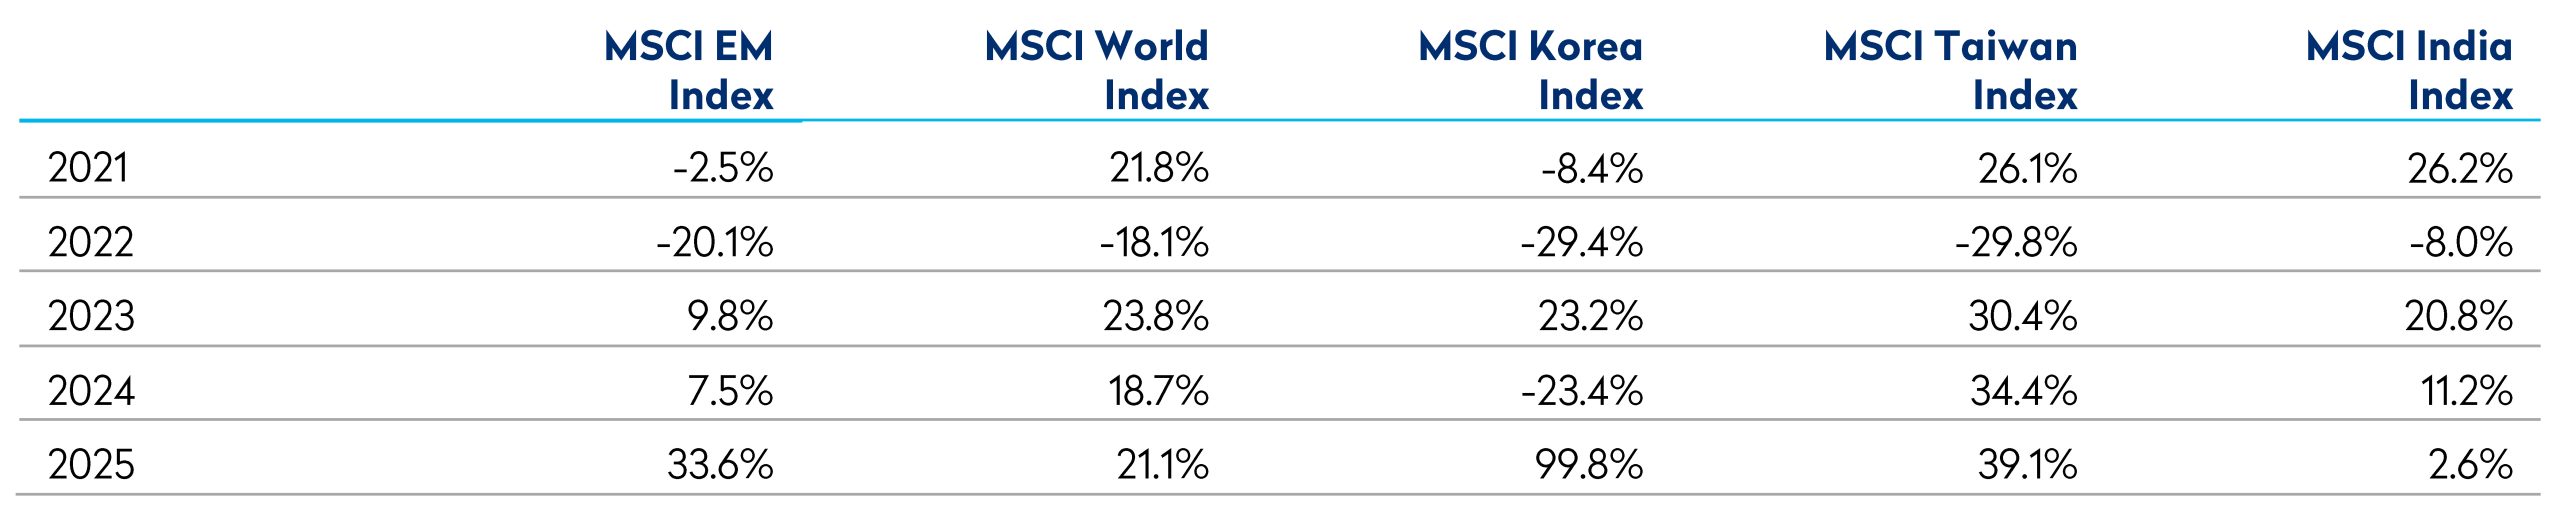
Emerging Market (EM) equities entered the year in a similar fashion to 2025, delivering strong absolute returns and further outperformance versus developed markets. Through February, the MSCI EM Index had risen 15%, led by technology heavy markets such as Korea (+56%) and Taiwan (+25%). The outlook appeared constructive, with capital returning to the asset class following a prolonged period of underperformance.
The macro backdrop at the start of the year appeared increasingly supportive. Disinflation trends in developed markets had begun to stabilise global financial conditions, while the Fed’s three cuts late last year, and expectations of further easing provided scope for a moderation in any external constraints facing EM economies. Against this backdrop, capital was incrementally reallocating towards higher beta regions, particularly those leveraged to global growth and technology investment.
However, the onset of the Iran conflict has interrupted this constructive backdrop. EM equities have retraced a meaningful portion of their recent gains, declining approximately 14% from peak levels. This conflict has refocused attention on the core transmission channels through which geopolitical shocks propagate through EM – higher energy prices, tighter global financial conditions, lower risk appetite, and potential disruption to trade and capital flows.
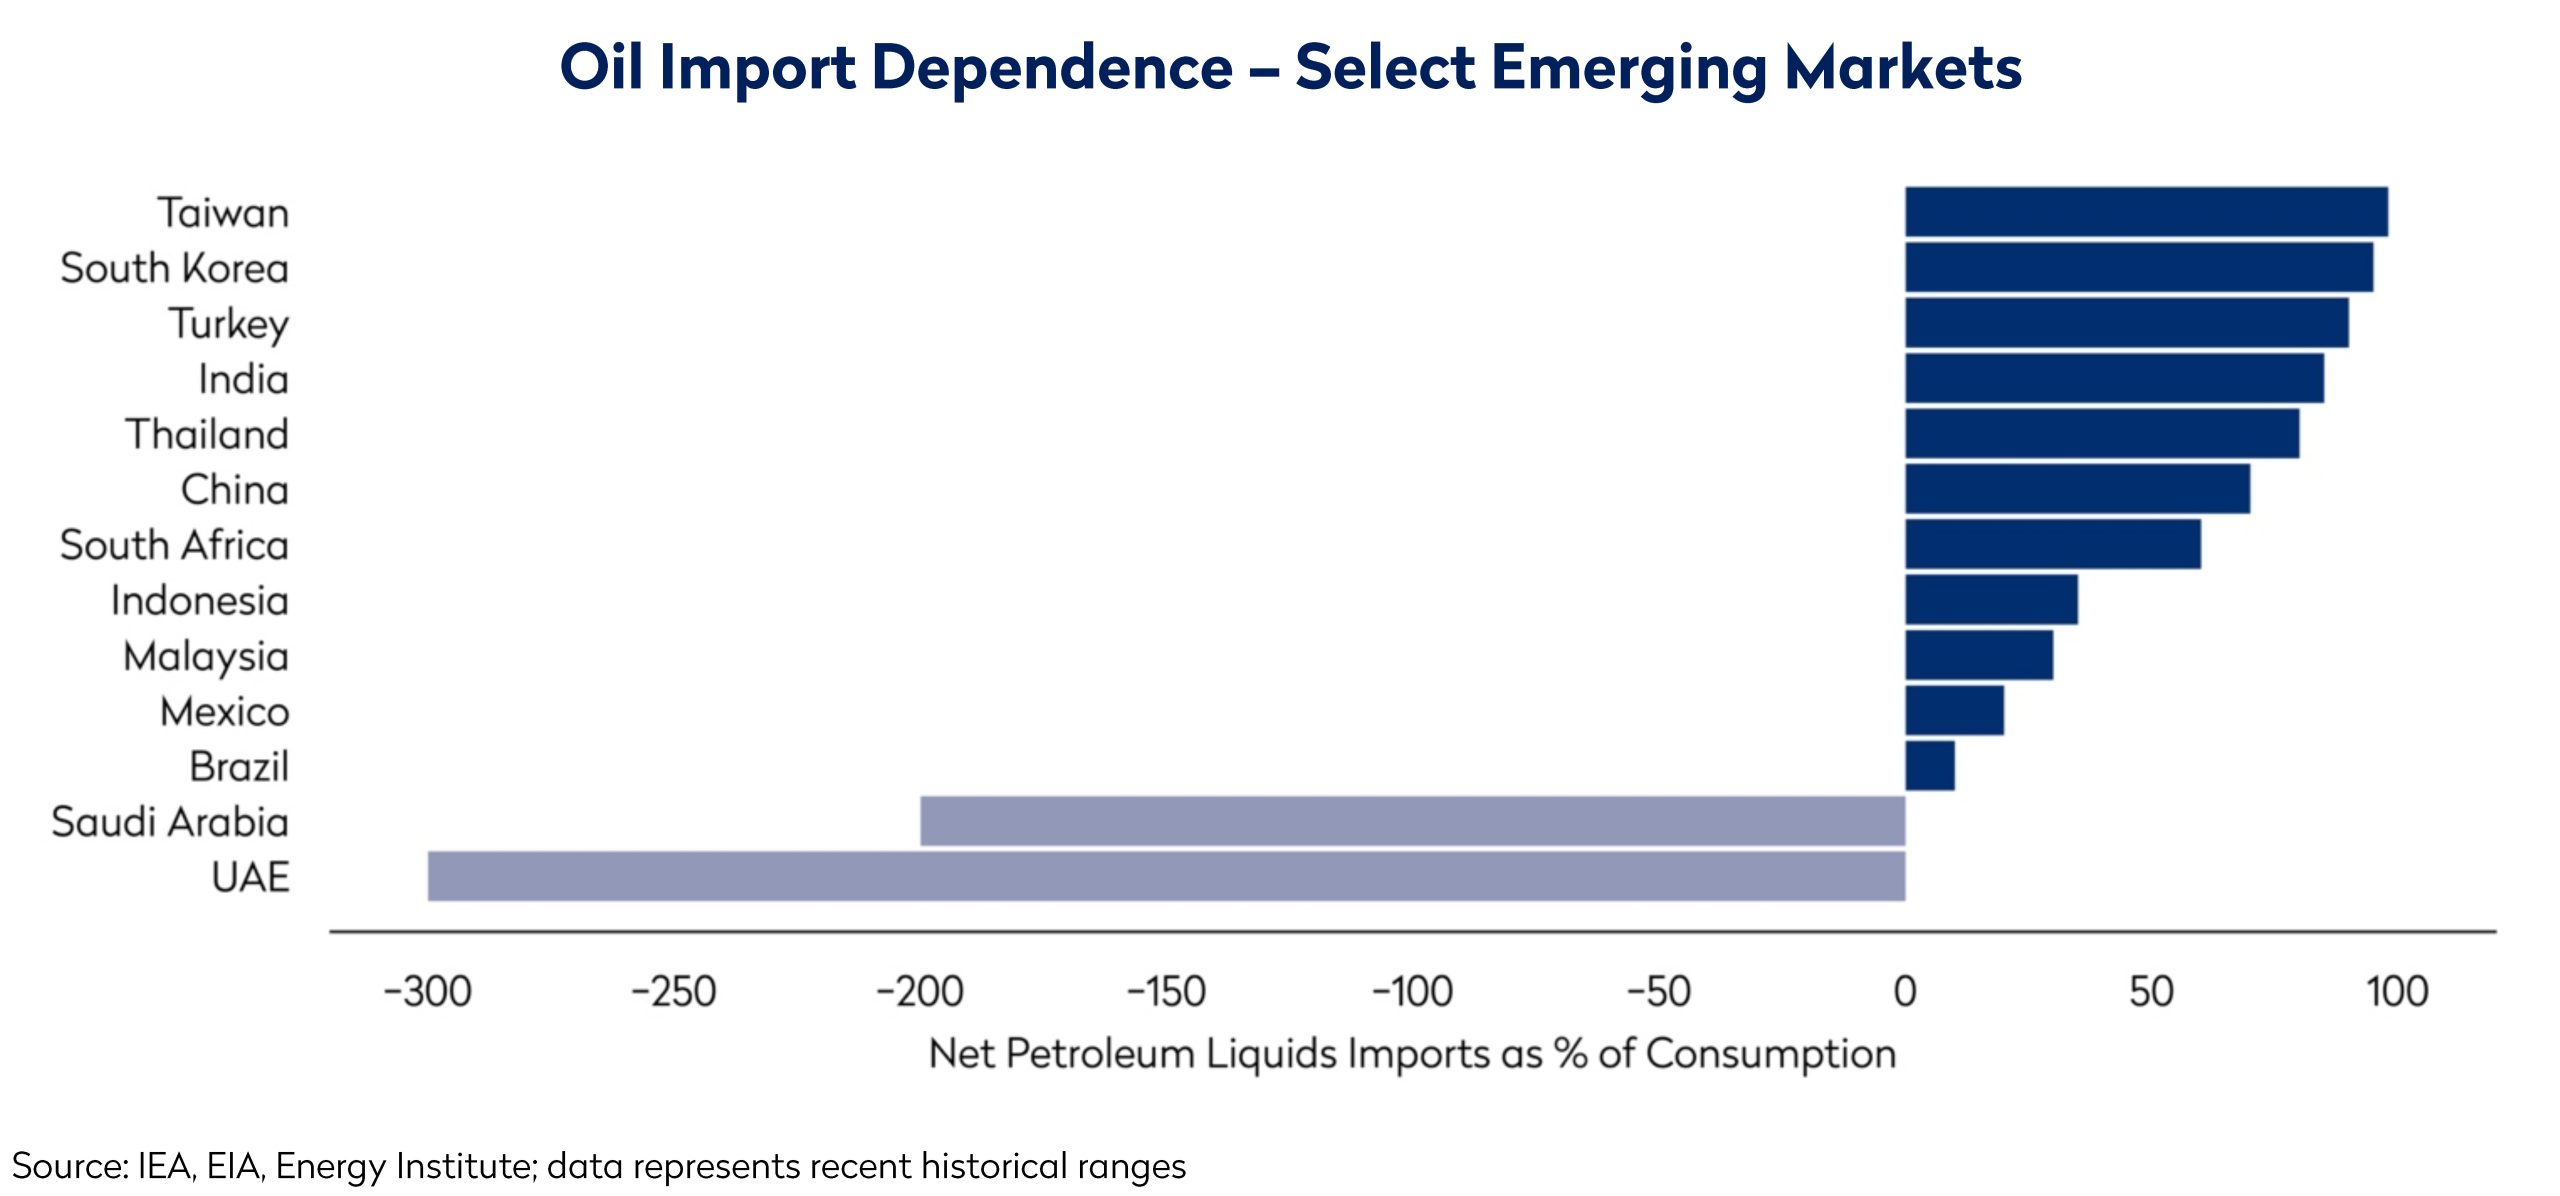
From a macroeconomic perspective, the conflict is likely to cause a significant supply shock on top of an already uneven global recovery. The resulting impulse of higher inflation alongside weaker growth, reintroduces stagflation dynamics that could be challenging for EM policy frameworks. The degree of impact varies significantly across regions, primarily reflecting differences in energy dependence, external balances, and policy credibility.
Below, we outline the implications for key countries and regions.
China
China’s direct exposure is limited, but second order effects are more relevant. As a large net energy importer, higher oil prices represent a negative terms of trade effect. An increasing share of electrification and renewable energy alleviates this, while administered pricing mechanisms smooth any pass through to end users. The impact though is absorbed elsewhere in the economy, through corporate margins and fiscal or local government balance sheets. This occurs at a time when policymakers are already facing challenges in stimulating domestic activity.
At the same time, further geopolitical fragmentation may reinforce China’s role in segments of global supply chains where it is viewed as relatively stable. This could partially offset external demand weakness, particularly in manufacturing. The renminbi has remained broadly stable, reflecting both policy management and a still robust external position.
Bottom-up: Performance has been bifurcated. IT platform companies have come under renewed pressure due to stock specific intensifying competition and elevated investment requirements; while more defensive exposures—energy, staples, utilities and telecoms—have demonstrated relative resilience, consistent with a shift towards lower beta earnings streams in a more uncertain macro environment.
India
India is among the more exposed large EMs to higher oil prices given its import dependence. Elevated crude feeds directly into inflation and widens the current account deficit, constraining policy flexibility and weighing on the currency. The rupee has depreciated ~5% this year, reflecting both oil dynamics and broader dollar strength.
Bottom-up: While structural growth drivers remain intact, the fundamental earnings impact will be affected by the duration of disruption caused by the conflict. Meanwhile, elevated valuations have left the market vulnerable. India declined 15% in March and 18% over the quarter, making it one of the weakest EMs year-to-date.
South East Asia
ASEAN presents a differentiated picture. Malaysia, as a net energy exporter, benefits from improved terms of trade, supporting fiscal and currency dynamics. In contrast, Thailand, Indonesia and the Philippines are more exposed to rising import costs and inflationary pressures.
Bottom-up: Malaysia held up well, supported by domestic financials such as Maybank. Holdings elsewhere in ASEAN came under pressure given external vulnerabilities and sensitivity to capital flow dynamics. External financing positions will remain a key area of focus as the conflict evolves.
Korea and Taiwan
Korea and Taiwan have been among the strongest performers year to date, driven by the global technology cycle and their positioning as significant beneficiaries of AI related capex. However, both have proven highly sensitive to shifts in global risk sentiment following such strong performance, particularly Korea.
The conflict has limited direct economic impact in the short term, but given a high dependence on energy imports this could change if the conflict becomes drawn out. Indirect effects via global demand, supply chains and positioning are also significant. Korea has exhibited elevated beta characteristics, with increased volatility in both equities and the won. This reflects the market’s longstanding cyclical composition and sensitivity to global liquidity conditions, as well as a surge in retail participation to the equity market in recent years.
Bottom-up: Performance in Korea has been influenced by memory names such as Samsung Electronics and SK Hynix which have participated in the strength of the memory cycle despite a pullback in March. Positioning has moderated given elevated valuations. Taiwan has been more resilient – TSMC – EM’s largest constituent has performed strongly year to date, supported by strong results and guidance.
Latin America
Latin America stands out as a relative beneficiary. Many economies in the region are net exporters of commodities, including oil and metals, and therefore positively exposed to higher global prices.
Improved terms of trade support currencies, fiscal balances, and external accounts, providing a macro buffer against global volatility. In addition, relatively limited direct exposure to the conflict enhances the region’s current defensive characteristics within the EM universe.
Bottom-up: Performance in Brazil has been particularly good in a regional context, supported by energy related names such as Petrobras, reflecting the leverage to higher oil prices, which should also support further increasing shareholder returns ahead.
The Middle East
The Middle East sits at the centre of the conflict, with divergent impacts across markets. For major exporters such as Saudi Arabia, higher oil prices support fiscal surpluses, liquidity and domestic investment. However, proximity to the conflict introduces geopolitical risk, increasing volatility and weighing on sentiment. For more diversified economies such as the UAE, the impact is more nuanced, with potential second order effects on tourism, real estate, and capital flows.
Bottom-up: Saudi exposures have appreciated, while UAE exposures, particularly Emaar Properties, have come under pressure amid concerns over real estate demand if population growth slows. Emaar’s substantial dividend yield relative to the market should offer downside support in weaker market conditions.
South Africa
South Africa presents a more complex picture. The market has benefited from elevated gold prices over the past year, although this relationship has recently weakened. Despite heightened geopolitical risk, gold prices have declined amid expectations of higher interest rates driven by energy induced inflation, weighing on gold equities.
South Africa is also a net oil importer, facing inflationary pressure and a weaker trade balance. Domestic structural challenges remain the dominant driver, and the rand has been among the weaker EM currencies.
Bottom-up: Positioning remains limited, with no exposure to domestic gold miners.
Conclusion
The sharp reversal following the onset of the Iran conflict underscores the sensitivity of EM assets to global macro shocks. Despite ending the quarter flat, EM returns extended their outperformance versus developed markets seen last year, with DM equities negative over the same period with MSCI World down almost 4%.
Looking ahead, the macro outlook remains highly uncertain. A prolonged conflict would likely sustain elevated energy prices, reinforce stagflationary pressures, and tighten global financial conditions, an environment that has historically been challenging for EM. Conversely, any credible de-escalation could trigger a reversal in oil prices, a recovery in risk sentiment, and a more supportive backdrop for capital flows.
In this environment, dispersion across countries and sectors is increasing. This reinforces the importance of active management and bottom-up stock selection, focusing on businesses able to absorb higher input costs and navigate shifting trade and geopolitical dynamics.
Maintaining valuation discipline, balance sheet strength, and downside protection remains central to portfolio positioning as the year progresses.
Disclosures
Views expressed were current as of the date indicated, are subject to change, and may not reflect current views. All information is subject to change without notice. Views should not be considered a recommendation to buy, hold or sell any investment and should not be relied on as research or advice.
This document may include forward-looking statements. All statements other than statements of historical facts are forward-looking statements (including words such as “believe,” “estimate,” “anticipate,” “may,” “will,” “should,” “expect”). Although we believe that the expectations reflected in such forward-looking statements are reasonable, we can give no assurance that such expectations will prove to be correct. Various factors could cause actual results to differ materially from those reflected in such forward-looking statements.
Neither MSCI nor any other party involved in or related to compiling, computing or creating the MSCI data makes any express or implied warranties or representations with respect to such data (or the results to be obtained by the use thereof), and all such parties hereby expressly disclaim all warranties of originality, accuracy, completeness, merchantability or fitness for a particular purpose with respect to any of such data. Without limiting any of the foregoing, in no event shall MSCI, any of its affiliates or any third party involved in or related to compiling, computing, or creating the data have any liability for any direct, indirect, special, punitive, consequential or any other damages (including lost profits) even if notified of the possibility of such damages. No further distribution or dissemination of the MSCI data is permitted without MSCI’s express written consent.
This material is for informational purposes only and is not an offer or solicitation with respect to any securities. Any offer of securities can only be made by written offering materials. The information set forth herein is a summary only and does not set forth all of the risks associated with the investment strategy described herein. The information was obtained from sources we believe to be reliable, but its accuracy is not guaranteed, and it may be incomplete or condensed.
Characteristics such as P/E and dividend yield are not reliable indicators of future results and are subject to change.
Calculations for characteristics are based on generally accepted industry standards. All characteristic data is produced using Mondrian’s accounting system data.
It should not be assumed that investments made in the future will be profitable or will equal the performance of any security referenced in this document. Examples of securities will represent only a small part of the overall portfolio and are used to illustrate our investment approach. Any holdings are subject to change and may not feature in any future portfolio. More information on holdings is available on request.
Unless otherwise stated, all returns are in USD.
All references to index returns assume the reinvestment of dividends after the deduction of withholding tax and approximate the minimum possible re-investment, unless the index is specifically described as a “Gross” index.
Past performance is not a guarantee of future results. An investment involves the risk of loss. The investment return and value of investments will fluctuate.
Mondrian Investment Partners Limited is authorised and regulated by the Financial Conduct Authority (Firm Reference Number: 149507). Mondrian Investment Partners Limited is also registered as an Investment Adviser with the Securities and Exchange Commission (registration does not imply any level of skills or training).