Summary
- In the first half of 2022, shares in pandemic beneficiaries lost their shine as discount rates rose and COVID-related earnings were seen to be less durable than once thought.
- The valuations of many of these Growth names remain stretched, however, even after their recent underperformance. Value has begun to make a comeback, but the divergence in performance between Value and Growth has only started to narrow.
- Historically, the deflation of extreme valuations has taken several years. As a case in point, Value enjoyed an extended period of outperformance as the gigantic gains of the dot-com boom reversed. Mondrian portfolios outperformed the Value index during this period.
- Our discipline in adhering to our value philosophy has allowed us to produce attractive long-term real returns and consistent return characteristics, outperforming when Value has outperformed.
Value Investing Rebounds
The past six months have seen some spectacular collapses in once high-profile stocks. While the year’s weakness had initially been concentrated among the most speculative assets – including meme stocks, cryptocurrencies and special purpose acquisition vehicles – this sell-off became more broad-based in the second quarter, driven by rising bond yields, a gloomy market outlook and an increasingly aggressive Fed. Shares that had rallied strongly at the height of the pandemic have been knocked from their peaks by war, inflation and the threat of recession.
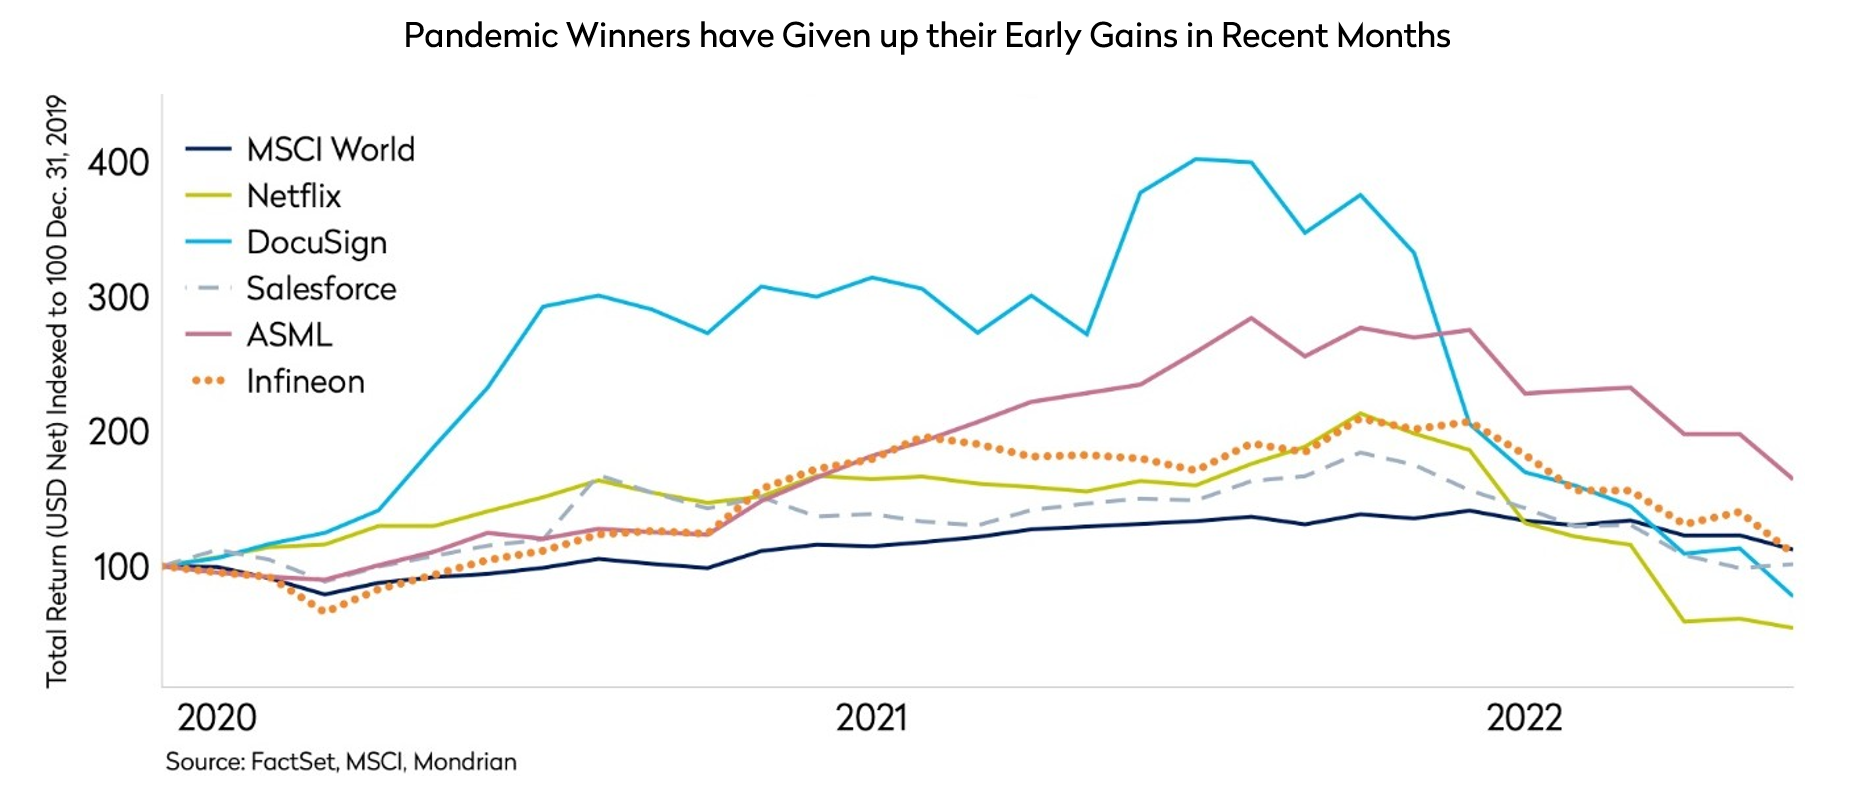
Earlier this year, we discussed how several pandemic narratives had resulted in significant multiple expansion in “Growth” segments of the market. Over the pandemic, investors had built on the “low interest rate Growth market” that developed post the financial crisis, focusing even more narrowly on those areas of the economy that they perceived to be pandemic winners. Markets seemed complacent, we wrote, as investors attached a high probability to the best-case scenario in some segments of the market. Investor exuberance had led to mispricing. In 2022, as the Fed started to tighten, the powerful rally in equities came to an end, and investor confidence in Growth stocks has been slowly eroded away. Consequently, many of these pandemic winners rapidly became losers, as discount rates rose and COVID-related earnings were proven to be unsustainable, with the likes of Netflix and Salesforce in the United States, and ASML and Infineon in Europe, giving up their earlier gains.
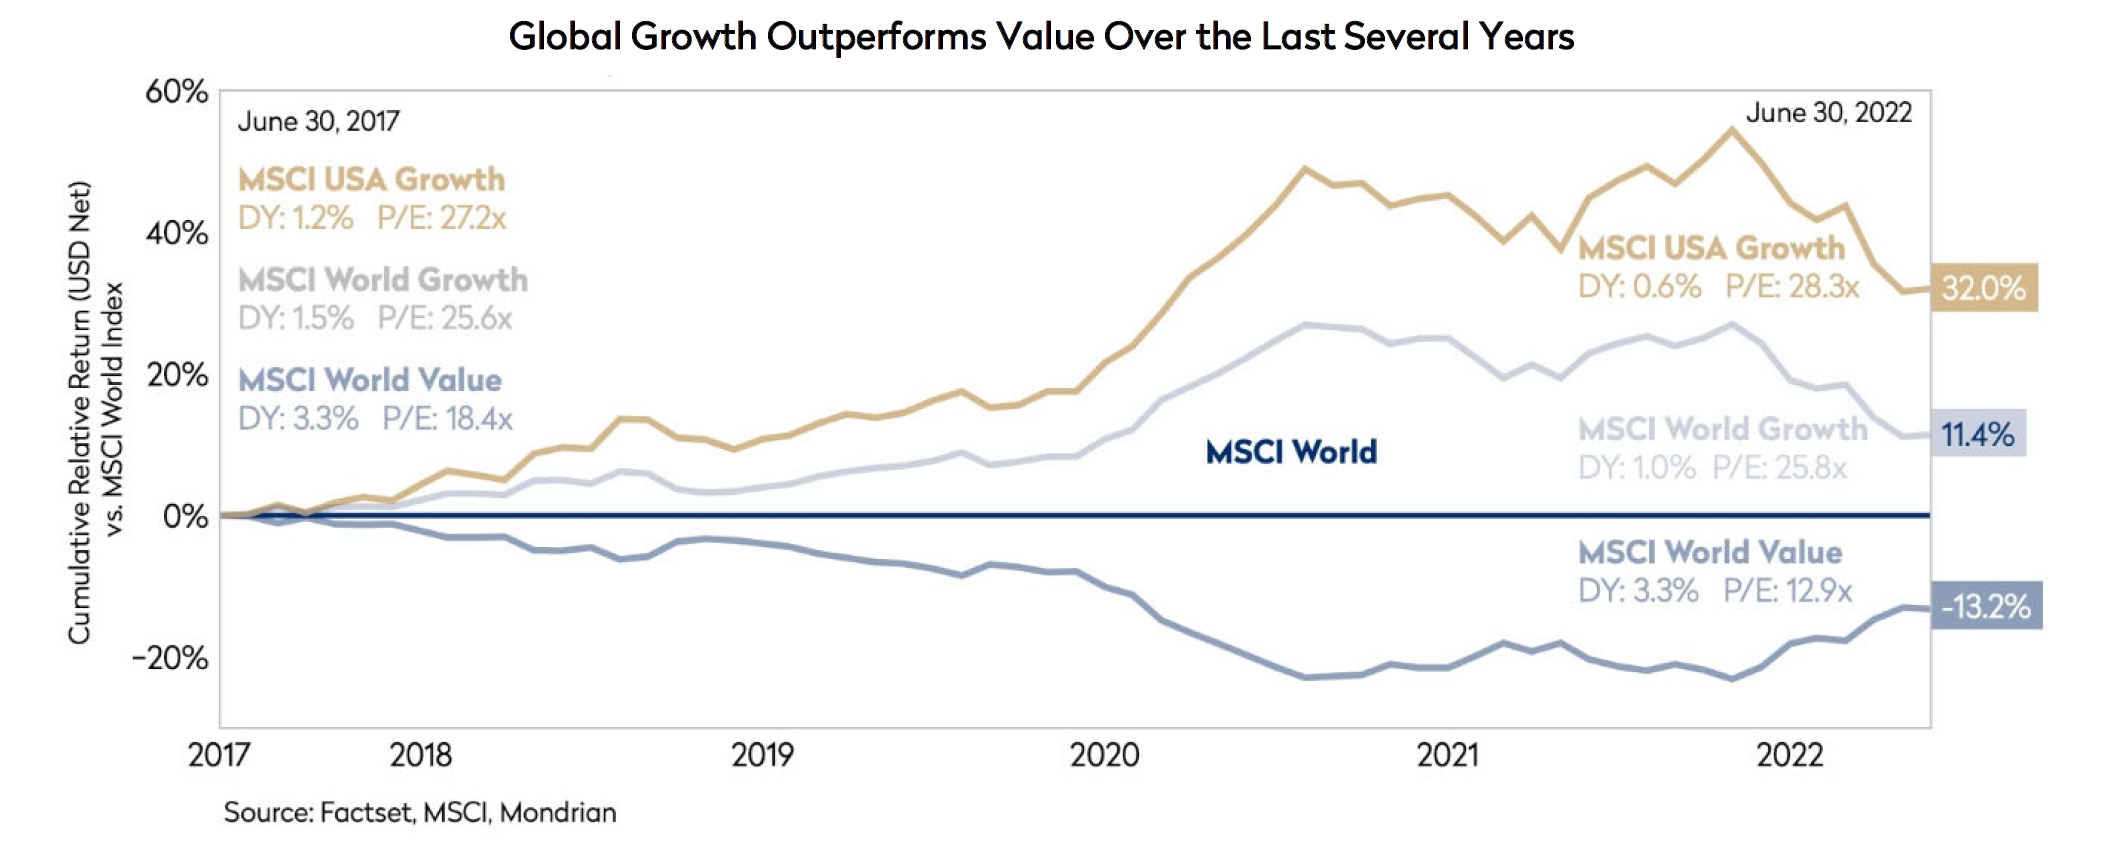
Despite the recovery in Value, the extreme Value/Growth bifurcation has only returned to pre-pandemic levels
The chart below illustrates the bifurcation in market returns, and the multiple expansion, that has created the divergence in performance between Value and Growth over the past five years. Value has begun to make a comeback for some of the reasons mentioned above. But despite the recent recovery in the Value style, the extreme Value/Growth bifurcation has only returned to pre-pandemic levels.
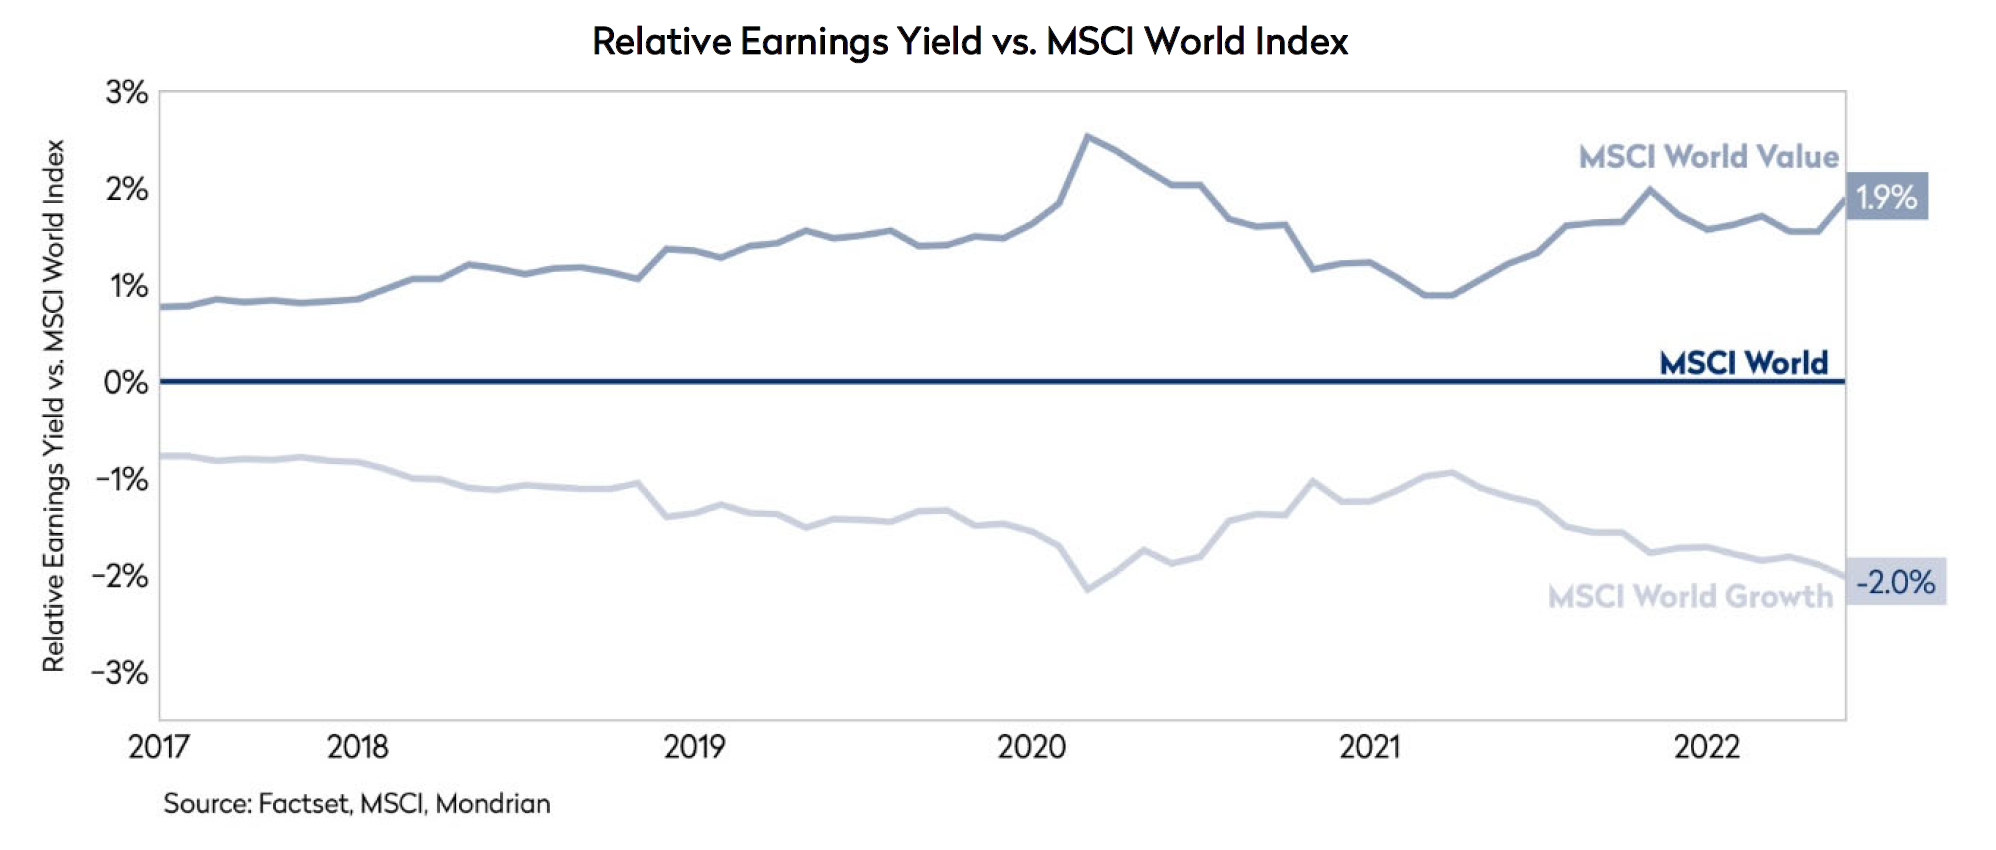
The valuation gap between the Value sub-sector of the market and companies at the Growth end remains stretched, even after Growth’s recent underperformance, as shown by the relatively simple analysis of earnings yield for the Growth and Value indices, seen in the chart below.
Historically, the deflation of extreme valuations has taken several years
It can take time for markets to resolve issues of overvaluation. The unwinding of the TMT boom in the late 1990s and early 2000s is a case in point: as the technology, media and telecom bubble deflated, Value enjoyed an extended period of outperformance, with the MSCI World ex-US Value benchmark outperforming the broader benchmark by 20.8% and 31.9% in the subsequent 3- and 5-year periods as investors recovered from the excesses of an overheated market.
While the World-ex US Value index provided a strong absolute return of 26.3% over the 5-year period from March 2000, the broader World ex-US and US indices, as well as the US Growth index, suffered losses: World ex-US was down 4.2%, the US index was down 20.0%, while the US Growth index declined by 39.9% (!) over the same five year period.
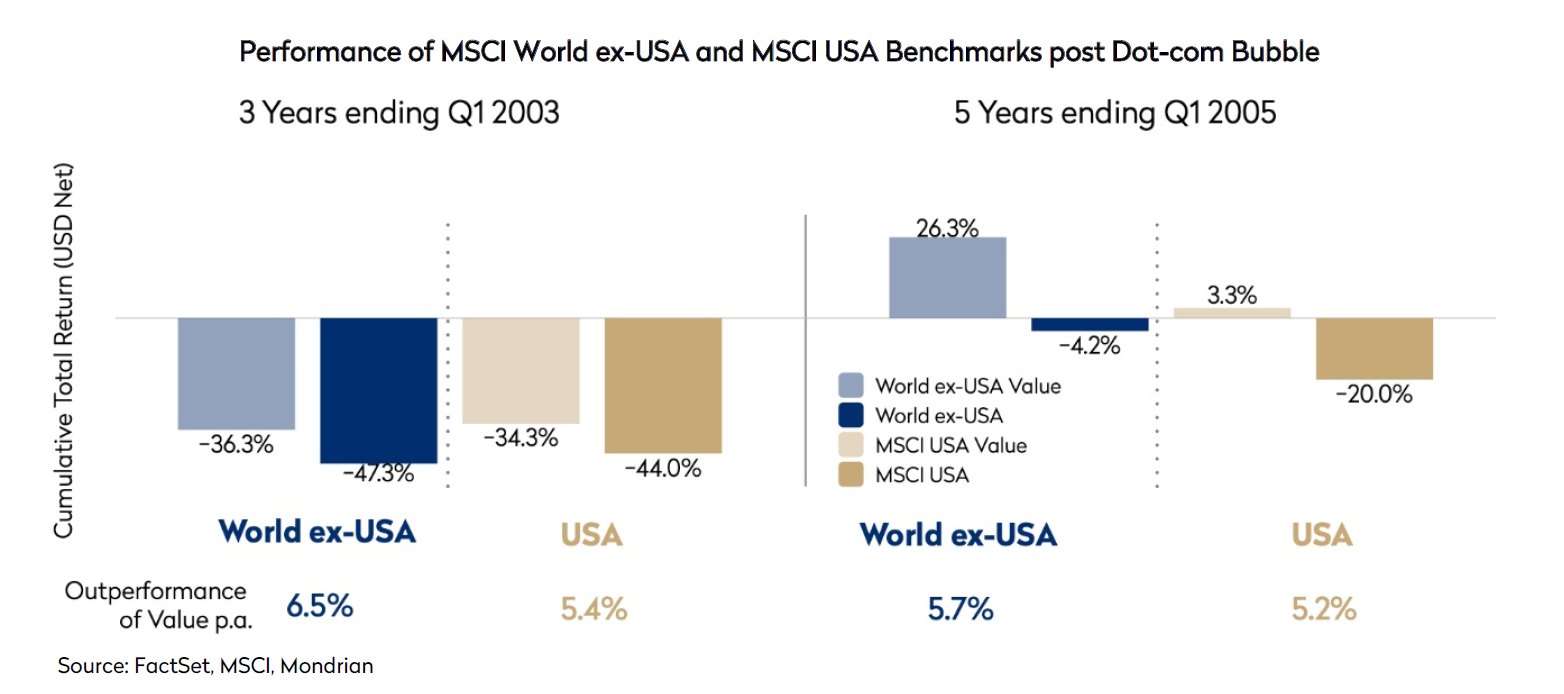
Over these periods, the Mondrian Global Equity composite achieved significant outperformance, beating the broader benchmark by 15.1% and 11.2% annualized in the subsequent 3 and 5 year periods, and the Value benchmark by 8.7% and 5.4% as we adhered to our time-tested philosophy.
In the late 1980s, many investors argued that the stratospheric valuations of the Japanese stock market were justified by fundamentals – given Japan’s interest rates were at consistently low levels compared to other developed markets, inflation was apparently dormant and the rapid rates of growth forecast for the Japanese economy. At the time, with Japan set to overtake the US as the world’s largest economy, investors rationalised the Japanese market’s price movements by citing expectations for the economy’s strong future growth and its low discount rate. Nevertheless, this level of growth had to be achieved going well out into the future to support the market’s rich valuation. The Japanese market peaked in the fourth quarter of 1989. Those investors who bought the Japanese market at the end of the 1980s earned nothing for almost thirty years until 2017: the heady growth forecasts built into their valuation models never materialized. Since 1975, the real return in Japan has been below the long-term real return for equity markets at 5%. While we had been underweight Japan since the inception of Mondrian in 1990, we increased our exposure to this market in 2017 in Global equity portfolios as we believed that the market’s previous overvaluation had more than unwound and that the Japanese market was finally presenting very attractive stock picking opportunities.
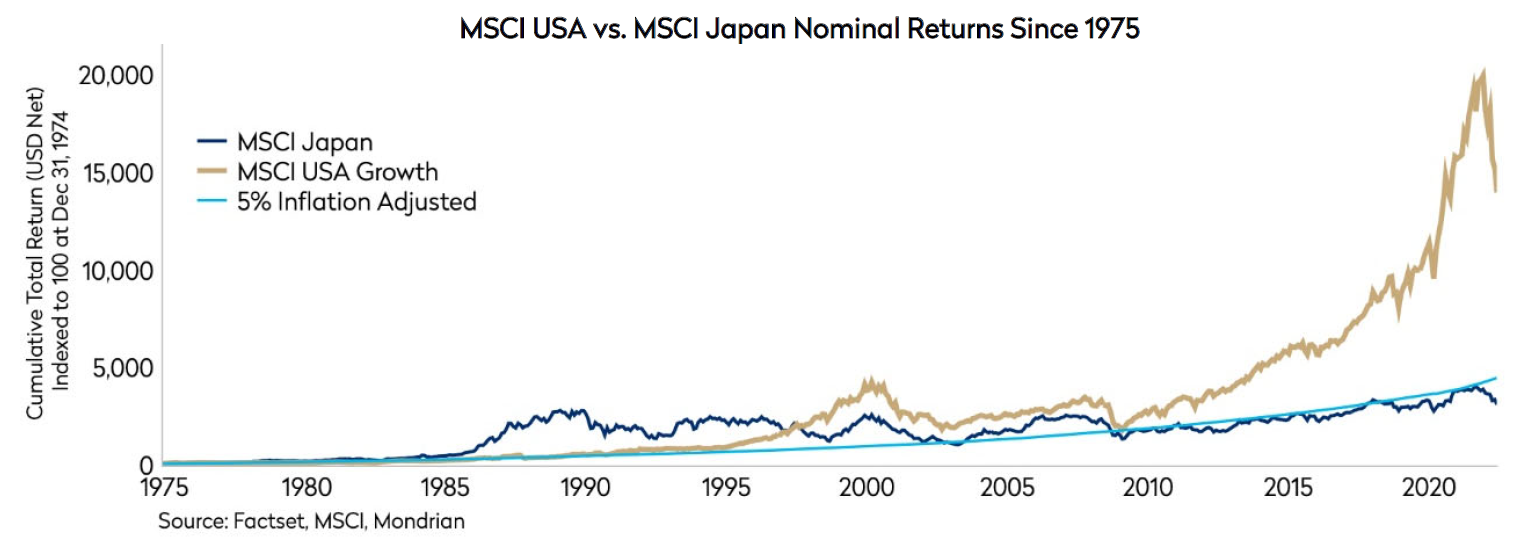
MSCI US Growth on the other hand, has provided a real return far in excess of 5%, despite the bursting of the dot-com bubble (discussed earlier) and the recent sharp correction. Having meaningfully lagged in the period 2000–2010 – a so-called “lost decade” – the US equity market has outperformed over the past decade (see the periodic table of returns below), supported by unprecedented central bank support and the recovery of the tech industry.

It has been a golden period for Growth investing (and for the US market) since the Global Financial Crisis. The US market is deep and liquid, the companies domiciled there frequently very dynamic, with a particularly strong focus on shareholder returns. The US is a clear leader in certain sectors, including healthcare, communication services and IT, where the US represents more than 85% of the developed world opportunity set. However, the valuations of many of these companies remain stretched. As a Value- oriented investor, we have maintained our underweight exposure to the US market on valuation grounds but continue to find stock picking opportunities in the market for Global equity portfolios, focusing on the fundamentals and cash flows of companies in order to help us maximize the probability of achieving a positive real return for our clients in the long-term.
Over the long-term Mondrian’s portfolios have done well against the broad index, the value sub-index, and have achieved strong real (inflation adjusted) returns
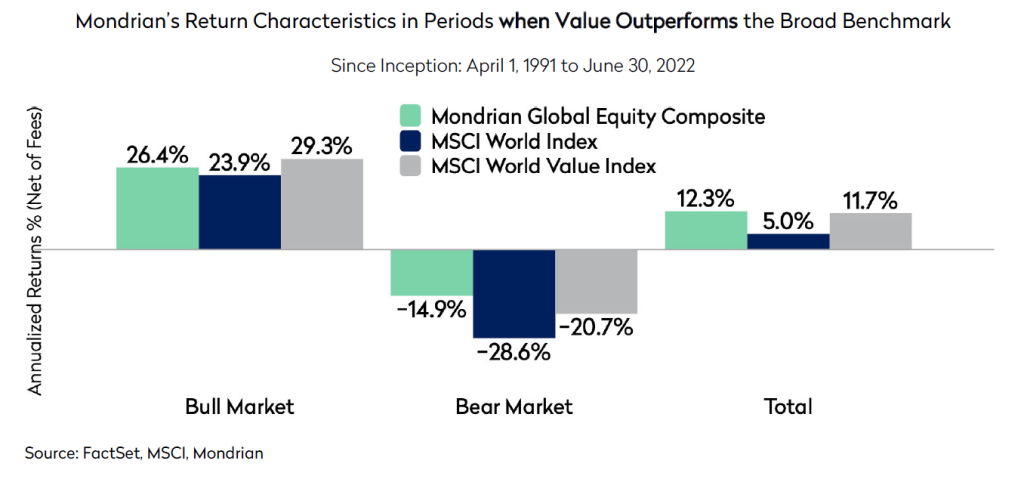
Our discipline in adhering to our long-term value philosophy has allowed us to produce attractive long-term real returns, and consistent return characteristics, including downside protection and low absolute risk. Historically, Mondrian’s Global portfolio has outperformed when Value has outperformed. The portfolio has beaten the standard benchmark when Value has outperformed, providing strong absolute returns when the market was up and significantly outperforming both the standard and Value benchmarks when the market was down. Crucially, we have outperformed the broad benchmark consistently when Value outperformed in bear market environments.
As performance is multiplicative, the portfolio has outperformed the standard and Value benchmarks in periods when Value outperformed Growth. We have achieved this with a lower level of absolute risk than the majority of our peers, and both the standard and Value benchmarks.
Historically, it is not unusual for returns from markets or sectors to dominate for a number of years and rotate due to relative valuations, growth and competitive cycles; these cycles may take a long time to unwind. Growth equities provided negative real returns for five years following the bursting of the tech bubble while it was possible to achieve positive real returns elsewhere in the market. Mondrian is unusual in the investment industry in that it has stayed true to its philosophy, process and valuation framework across market cycles since its inception as a firm in 1990. We are valuation driven, but we are not wedded to the old economy, or to legacy market leaders. The disruptive integration of the internet, automation, social media and artificial intelligence is transforming business models and reinventing industries. As underlying fundamentals evolve, we incorporate these changes into our long-term valuations, giving us the opportunity to choose the stocks with what we believe are the best risk-adjusted returns within a structured scenario analysis framework. While we are not drawing close parallels between the Japanese or tech bubbles and the current equity market environment, we continue to find immense opportunity within the Value segments of the market, despite Value’s more recent outperformance.
The past decade has undoubtedly been very challenging for defensive, value-oriented global investors. Today’s equity markets, especially those that are highly priced, are facing increased volatility with the repricing of risk and cost of capital. An environment where valuations are becoming increasingly consequential presents opportunities for a manager like Mondrian, which uses a disciplined valuation framework to produce attractive real rates of return with defensive value performance characteristics. We believe that the skew of outcomes is in our favor in the coming decade.
Disclosures
Performance returns marked “Net” reflect deduction of investment advisory fees and are calculated by deducting a quarterly indicative fee from the quarterly composite return.
Mondrian claims compliance with the Global Investment Performance Standards (GIPS®). GIPS® is a registered trademark of CFA Institute. CFA Institute does not endorse or promote this organization, nor does it warrant the accuracy or quality of the content contained herein. A GIPS Composite Report is available on request from mondrian.website@mondrian.com.
Views expressed were current as of the date indicated, are subject to change, and may not reflect current views. All information is subject to change without notice. Views should not be considered a recommendation to buy, hold or sell any investment and should not be relied on as research or advice.
This document may include forward-looking statements. All statements other than statements of historical facts are forward- looking statements (including words such as “believe,” “estimate,” “anticipate,” “may,” “will,” “should,” “expect”). Although we believe that the expectations reflected in such forward-looking statements are reasonable, we can give no assurance that such expectations will prove to be correct. Various factors could cause actual results to differ materially from those reflected in such forward-looking statements.
This material is for informational purposes only and is not an offer or solicitation with respect to any securities. Any offer of securities can only be made by written offering materials, which are available solely upon request, on an exclusively private basis and only to qualified financially sophisticated investors.
The information was obtained from sources we believe to be reliable, but its accuracy is not guaranteed and it may be incomplete or condensed. It should not be assumed that investments made in the future will be profitable or will equal the performance of any security referenced in this paper. Past performance is not a guarantee of future results.
An investment involves the risk of loss. The investment return and value of investments will fluctuate.


