

Since the Global Financial Crisis (“GFC”) in 2008, the composition of the emerging market (“EM”) equity index has been through considerable change. We would argue that the investment case for allocating capital to EM has also changed as a result. Once upon a time the arguments revolved around GDP growing faster than developed markets, better demographics, the rise of the middle class consumer, government reforms, improving governance, and a strong link to commodities amongst others. Now, while some of those points still apply, the argument has shifted more in favor of China, and Asia being at the forefront of global technological adoption and innovation. We believe this brings new and more supportable qualities to the investment case in EM today when compared to 10-15 years ago. First though, we will detail this composition change.
The Changing Face of Sector Composition
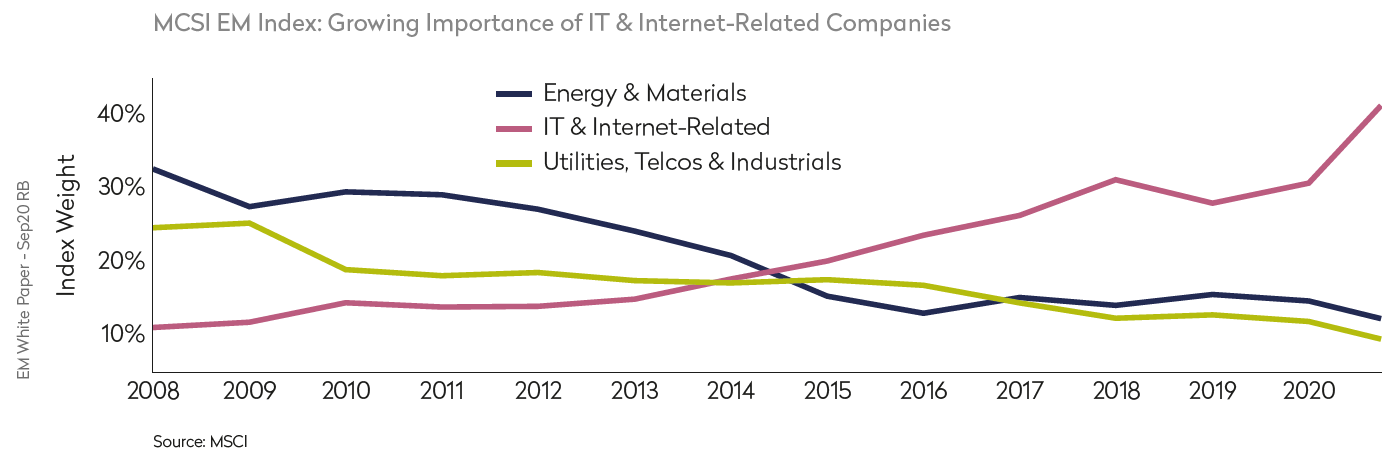
In October 2008, natural resources dominated the EM Index. China’s growth in the early part of that decade was propelled by infrastructure investments which drove up metals and energy prices, and benefited countries that supplied such commodities. The Materials & Energy sectors hence grew, and together accounted for 29% of MSCI EM. But over the next decade, China launched successive 5-year plans that sought to rebalance its economy to a more sustainable path less reliant on fixed assets and more driven by consumption and services. Outside of China, weak global economic growth post GFC, ample supply of commodities such as iron ore, oil and shale gas, further dampened the outlook for these two sectors. Today, the materials and energy sectors account for 13% of EM, falling by more than half and in so doing diminishing their relevance for EM returns. In contrast, technology stocks only accounted for 13% of the index in 2008. However, the ensuing decade witnessed the launch of 3G and 4G and affordable smartphones, and a massive expansion in internet services. The take-up of technology was accelerated by young demographics across emerging Asia, and poor or inaccessible service in traditional areas such as retail and banking. Crucially, in a region with a high number of science, technology, engineering and math (“STEM”) graduates, the talent pool across Asia was also abundant and low cost. Today, China’s R&D spending has advanced to ~$550Bn per year from about $150Bn a decade ago, and ranks 2nd globally in absolute spending, after the USA. Korea and Taiwan are two other countries within emerging Asia with a high intensity of R&D spending, as measured by R&D as a % of GDP according to UNESCO. It is no surprise then, that the combination of industry growth and new stock issues has seen outperformance of the technology and internet-related sectors with a combined benchmark weighting of just over 40% today, an increase of 27 percentage points. The only other sector of note to have increased its weighting is healthcare but by just 2% to 4.4%, also helped by technological advancement in bio tech and health tech.
Technology’s growth has not just come at the expense of the natural resources sectors; various other ‘old economy’ sectors have fallen too. Telecommunications has fallen from 13.2% to 3.4% as the build-out of the telecom networks concluded, penetration matured, and a combination of regulation and competition eroded returns. Likewise, the Industrials and Utilities sectors lost a combined 5% in weight driven by similar dynamics of regulation and low growth.
The Changing Face of Country and Regional Composition
Not only has the sector composition shift profoundly changed the case for investing in EM, but the country and regional shifts are just as illuminating. By far the most significant change has been the substantial growth of China. In fact, China is the only market to have had noteworthy growth in index weight over the last ten years, almost tripling in importance to 42% of EM today from just 15% in 2008. As a result of China’s growth, but also the significant underperformance of the Latam and EMEA regions, Asia now dominates the EM index, rising to 81% from 54%.Commodity linked markets such as Brazil, South Africa and Russia have fallen from a collective weight of 29% to just 11% today, and hence LatAm and EMEA combined now only equate to 19% of MSCI EM.
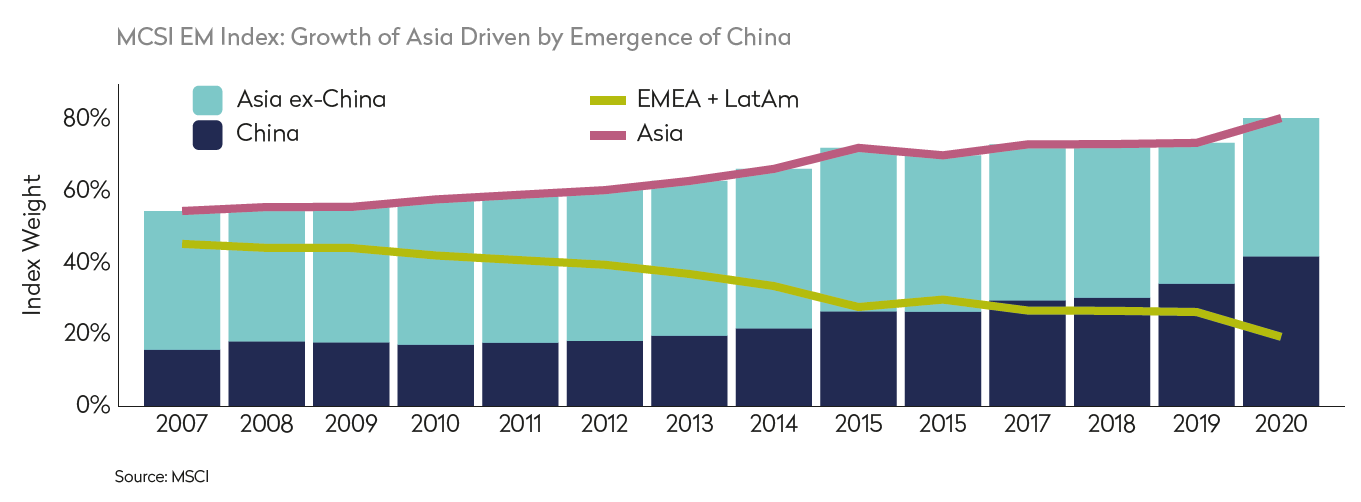
China has grown due to a combination of factors. Firstly of course, its economic growth has consistently outperformed almost all other countries. Secondly, there have been a number of very large new issues, primarily in the technology sector such as the listings in Alibaba, Meituan, JD.com and Pinduoduo that have mostly performed extremely well and therefore enhanced China’s weight. Thirdly, MSCI added local ‘A’ shares and some ADR’s to the index further increasing
China’s weight.
In stark contrast, the regions of LatAm and EMEA over the last ten years have for the most part been a story of decline. Economies such as Brazil, Mexico, South Africa, Turkey and Russia have proved fragile as political upheaval, corruption, and a lack of investments in education, has held back economic growth. Alongside poor local stock market performance, deep FX losses driven by vulnerable fiscal and current accounts have further eroded returns. Since October 2008, the Turkish lira has fallen an astonishing 80%, the Brazilian real 62%, the Russian ruble 51%, and the South African rand and Mexican peso just over 40%. Contrast this with the Taiwanese dollar which is up 14% in the same period, the Korean won up 10% and the flat Renminbi. This FX picture further explains the divergence in Asian and non-Asian country weights.
The Changing Investment Case for Emerging Markets
As a result of the above and the current structure of EM countries, regions and sectors, we believe the investment case for EM is more robust and attractive today. That Asia is such a large component bodes well given the more stable political structure in countries like China, higher savings levels across Asia, and more levers to support growth. Likewise, that the index has a higher proportion of domestically driven sectors such as services and technology rather than cyclical commodities also enhance the long term sustainability of the asset class in our view. Much of the volatility in EM over the last 10-20 years has come from the challenging performance of LatAm and EMEA which has lowered overall returns. We don’t see this trend of Asian outperformance reversing over the long-term. Most of the large Asian countries have managed and dealt with COVID-19 better than many, and have seen life return to relative normality much faster. Yet, Brazil, Mexico, South Africa and Russia in particular have had very high case rates and their already fragile economies are suffering greatly as a result. The long-term outlook therefore remains highly uncertain and challenging for EMEA and LatAm compared to Asia which went into the crisis much stronger too. We therefore believe that the dominance of Asian markets creates a more robust investment case for EM given the top- down stability of Asia when compared to LatAm and EMEA whichare now a much smaller proportion of the index.
These advantageous country and sector shifts are also reflected in a comparison of the largest index weighted stocks today compared to 2008. The top 10 from October 2008 included Petrobras & Vale in Brazil, Gazprom in Russia, and America Movil in Mexico, reflecting the capital-intensive, often state-owned, commodity or regulated companies of that era, with little representation from Asia. Today, all but one of the Top 10 stocks resides in Asia and there is a heavy leaning towards technology related companies. The leading constituents of the EM index today are largely innovative have dynamic and entrepreneurial management teams, rely on less capital and debt, and are more aligned to shareholders in driving returns. We believe this marks a fundamentally attractive shift for investors allocating to emerging markets, where the investment opportunities come from sustainable sources of competitive advantage and are therefore likely to improve the asset class’ risk-adjusted returns in the years to come.
Mondrian’s Positioning and Conclusions
In recognizing these shifting dynamics, we have been progressively shifting the portfolio towards Asia over the last few years. This continued as opportunities arose during the depths of the market sell-off in Q1 and Q2. We believe this shift will help produce better and more resilient returns for our clients. The sad truth is that the regions of LatAm and EMEA have perennially disappointed and we see little hope of meaningful long term change. Nonetheless, we have select investments in these regions where we identify attractive returns and to ensure diversification, but c.85% of our
investments are within Asia today.
We continue to believe that Asia’s investment in enabling technologies such as 5G, AI and cloud computing; relatively high and increasing spending in R&D; and consumption growth potential will see the region continue to out-perform. It is exciting to contemplate that emerging markets are the home of great innovators and revolutionary companies that are not just emerging market leaders, but global leaders such as Tencent, Alibaba, TSMC and Samsung. COVID-19 has only accentuated the global trends towards technology and therefore Asia’s comparative advantage should only widen. We believe this shifting dynamic will help to create the foundations for higher and more sustainable EM returns over the next ten years. With the positioning of our portfolio today, we are well placed to take full advantage of this exciting investment opportunity ahead.
Views expressed were current as of the date indicated, are subject to change, and may not reflect current views.
Views should not be considered a recommendation to buy, hold or sell any security and should not be relied on as research or investment advice. It should not be assumed that investments made in the future will be profitable or will equal the performance of any security referenced in this paper.
The information was obtained from sources we believe to be reliable, but its accuracy is not guaranteed and it may be incomplete or condensed. All information is subject to change without notice.
This document may include forward-looking statements. All statements other than statements of historical facts are forward- looking statements (including words such as “believe,” “estimate,” “anticipate,” “may,” “will,” “should,” “expect”). Although we believe that the expectations reflected in such forward-looking statements are reasonable, we can give no assurance that such expectations will prove to be correct. Various factors could cause actual results or performance to differ materially from those reflected in such forward-looking statements.
The material is for informational purposes only and is not an offer or solicitation with respect to any securities. Any offer of securities can only be made by written offering materials, which are available solely upon request, on an exclusively private basis and only to qualified financially sophisticated investors.
Past performance is not a guarantee of future results. An investment involves the risk of loss. The investment return and value of investments will fluctuate. There can be no assurance that the investment objectives of the strategy will be achieved.
This document is solely owned by and the intellectual property of Mondrian Investment Partners Limited. It may not be reproduced either in whole, or in part, without the written permission of Mondrian Investment Partners Limited.