
Introduction
The concept of value investing means different things to different people. Value investing is an investment paradigm that involves buying securities that appear underpriced by some form of fundamental or quantitative analysis. The various forms of value investing derive from the investment philosophy first taught by Benjamin Graham and David Dodd at Columbia Business School in 1928, and subsequently developed in their 1934 text Security Analysis. The early value opportunities identified by Graham and Dodd included stock in public companies trading at discounts to book value or tangible book value, those with high dividend yields, and those having low price-to-earning multiples, or low price-to-book ratios. Warren Buffet expanded the value concept with a focus on “finding an outstanding company at a sensible price” rather than generic companies at a bargain price. Two key features ring true whichever way one looks to cut it. Firstly, all value investors are looking for a clear margin of safety in their investments as a result of the inherent undervaluation. Secondly, for choice, many value investors are also looking for companies that exhibit some form of future growth profile. It is the price they pay for this growth that matters most. Ironically, growth managers will never say they are willing to overpay for growth, they, for choice, would also prefer a margin of safety and an attractive valuation.
Mondrian has applied a clear value philosophy since the company’s inception in 1990. We have always used a Dividend Discount Model (DDM) methodology to define and calculate value on a global basis. Expressing value through a dividend discount model is another slightly different interpretation of value to those referenced above, and is not simply an approach isolating companies with high dividend yields today. A DDM takes the dividend today (or lack of it) and forecasts the expected growth of those dividends into the future. Mondrian uses the DDM to analyze in detail the sustainability of a business’s cash flows today and where they may trend over the long term. Therefore, a DDM does not ignore growth either; it looks to price that growth (or lack of it). Furthermore, we have an approach that explicitly analyses the margin of safety in an investment by evaluating various scenarios by looking at the range around the most likely case. A narrow range or a stock trading close to its worst case suggests an attractive margin of safety to us, or as we more typically say, skew.
Ascertaining various portfolio factors, including exactly how value focused any investment manager’s portfolio may be, has become an increasingly common practice. Technology has created a plethora of new tools to enable asset owners of all types, as well as their consultants and advisers to analyze a manager’s portfolio and determine how strong the simplistic value credentials are. For example, Style Analytics and Barra have created significant businesses by providing this data. State Street, BlackRock and WisdomTree have taken this a step further by creating value products that try to replicate through factors the many hours, days and weeks’ fundamental stock pickers spend looking at investment opportunities. MSCI also responded years ago by creating Value and Growth indices to better help measure how asset managers are performing versus their supposed style.
As explained, value has somewhat different meanings depending on one’s specific interpretation. We thought it would be interesting to further expand, and give our explanation of Mondrian’s emerging market portfolio value credentials by looking through a few different lenses.
MSCI Value and Growth Indices
Firstly, we look at what MSCI defines as value and growth stocks as they are the benchmark providers of choice for most of our clients. It is important to mention that some companies can appear in both indices which further highlight the challenges with a simple, uninformed analysis.
MSCI use different parameters to define value looking at a combination of 3 factors; price to book, forward price to earnings and dividend yield. Immediately, one can see how MSCI’s definition and Mondrian’s may vary, given our focus purely on dividends and dividend growth. Furthermore, the constituents can change on a quarterly basis. Nevertheless, we flipped this around and took a look at the growth index at March end to see if we had many companies on our portfolio MSCI considers to be growth. We analyzed the top 200 companies by weighting in the MSCI Growth Index (86% of the total). We owned 13 of these, but 7 of them also appear in the MSCI Value index too, so these can be discounted. Therefore of the top 200 growth companies as classified by MSCI, we only owned 6. These 6 account for just 15% (approximately) of our portfolio. Each can be justified on our DDM, each have a unique investment case, and each offered a margin of safety when we initiated. We will discuss Alibaba separately below, the others are as follows:
- TSMC – one of the leading technology companies globally. We have owned this stock since 2005. It has created huge value and remains attractively valued.
- LG Chem and Samsung SDI – We own these primarily for their electric vehicle battery profile in which the companies have a clear competitive advantage. The growth here is unique and justifiable given the low base.
- CSPC – a leading drug producer in China. We owned this historically and sold it during the first half of 2018 when we felt it became too expensive. We have been buying it back in Q2 after an approximate 45% fall from its peak price last year.
- Suzano – we believe the multiples are artificially inflated right now which gives an unfair reflection of the inherent value in the stock. We have owned this since 2016 and it has been a significant outperformer.
Therefore, if one compares Mondrian’s EM portfolio and the MSCI EM Growth Index, there is little commonality. A growth manager we certainly are not. That being so, how do the portfolio multiples look when compared to the broad benchmark?
Comparing our Portfolio to the MSCI EM and EM Value Index
At the end of June, the portfolio’s crude historic key metrics compared favorably to the benchmark with a discount on every measure and showing healthy stand- alone traditional value metrics, consistent with the past.
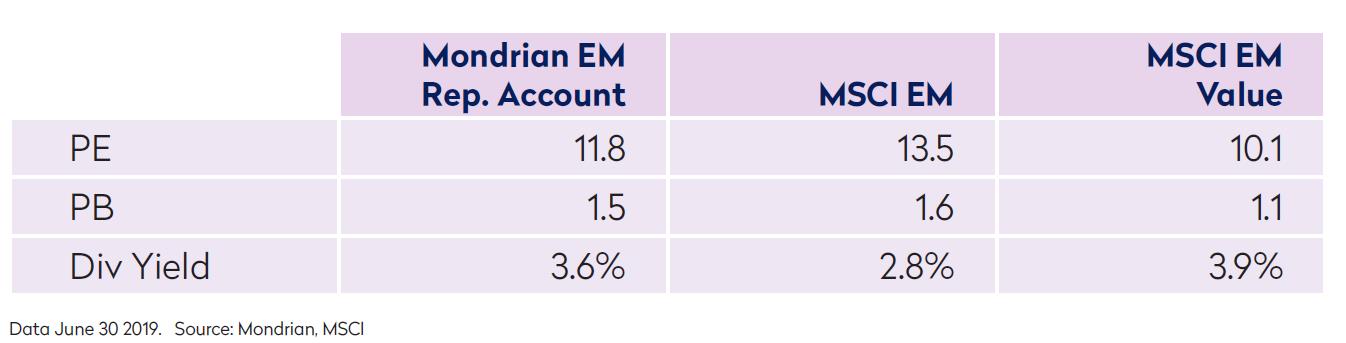
Despite this Mondrian’s portfolio is at a premium to the value index, but we believe based on our time tested methodology, there are good reasons why. Once again, understanding the data being assessed is so critical here. While MSCI keep country weights broadly the same in the value and growth indices as the standard index, this is not the case for sectors. This creates imbalances and distortions which all investors should carefully consider. The main difference is the weighting of financials at 37% of the value index. Of this, approximately 41% are Chinese financials alone. Consequently, 15% of the Value index is made up of one country’s financial sector alone and with this comes significant concentration, correlation, and possibly regulatory risk. Hence there are significant risks with investing clients’ assets to even achieve a benchmark weight here. Energy and materials total another 23%, so 59% sits in these 3 sectors.
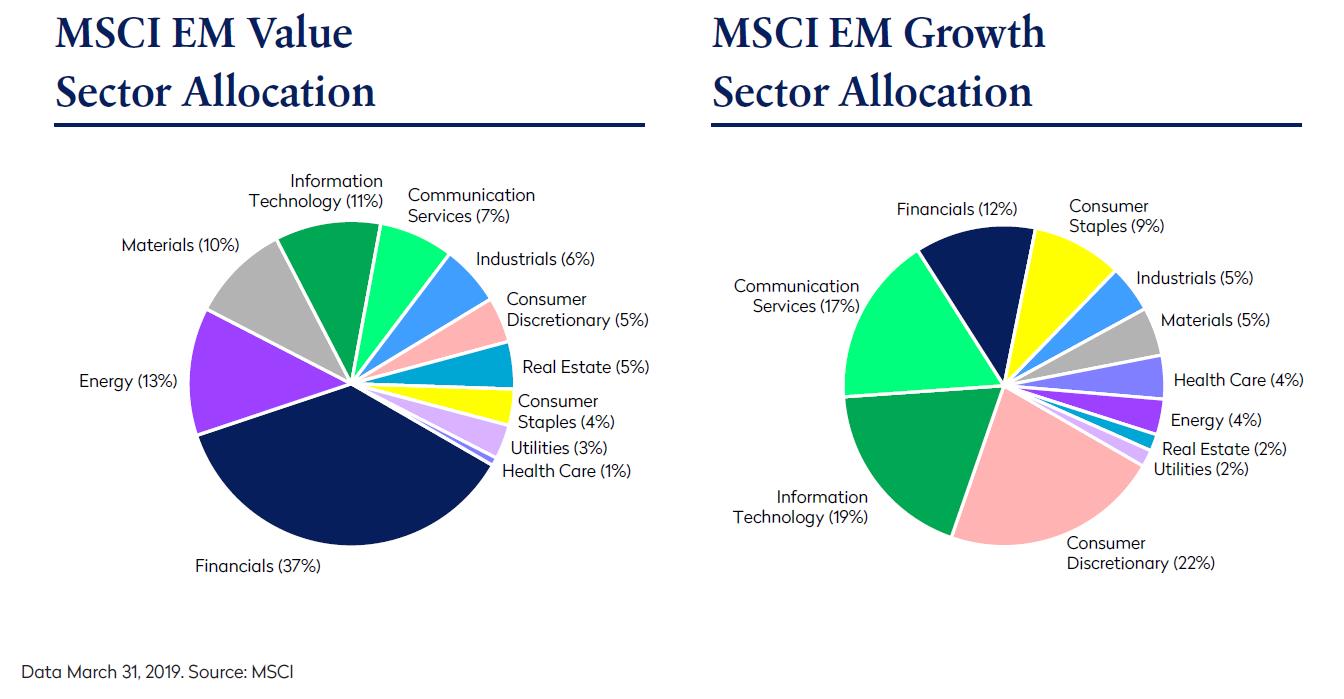
Our more diversified portfolio has 47% in these 3 areas, a still substantial allocation to a value space, but the underweight helps explain why the portfolio would not “look” as cheap as the value index, yet still clear value when compared to the broad benchmark.
Furthermore, at Mondrian, we look to deliver a defensive value portfolio. A focus on aiming to avoid disasters therefore plays an integral role in portfolio construction alongside screening for value. In our view, understanding where and how to avoid these potential disaster areas within the value spectrum, both from a top down and a bottom up perspective will enable us to deliver a defensive portfolio with low standard deviation of returns. This is another reason why we wouldn’t necessarily want to somewhat mirror the value index.
At Mondrian, we don’t buy shares because they ‘’look’’ cheap. Shares can be cheap because the underlying business is a poor one, or it operates in an industry that is under severe structural or cyclical pressures. Extreme cheapness can also be associated with higher than average levels of volatility, particularly if it results from cyclicality. The focus on intrinsic value and stable return is more critical to achieving our stated portfolio objectives.
How does a Value Manager own Alibaba?
We bought Alibaba at the start of 2019 after it fell 35% from its peak in June 2018. In fact, by January 2019, Alibaba was trading at an 18 month price low, despite the business continuing to grow appreciably in that time. Alibaba therefore significantly de-rated to much more attractive valuation levels while also offering a favorable margin of safety. We believe this investment highlights the benefits of using a DDM to calculate value. Mere traditional value multiple methodologies may overlook or disregard the huge potential in a business such as Alibaba. For a value manager such as Mondrian to buy Alibaba, we needed to have the confidence in the future growth of operating profits and free cash flow such that it can pay reasonable dividends over the long term. We have this confidence given Alibaba’s entrenched position in China today. It has created an enviable ecosystem which should prove extremely durable and sustainable.
We do not have this same confidence in Baidu. Of the BAT (Baidu, Alibaba, Tencent) group, Baidu had the most value like optical metrics at the end of last year after its own 40% fall from peak levels in June 2018. One could have bought this tech powerhouse on a PE of 15x and a PB of 2.6x in early January, alluringly value like levels for a behemoth Chinese internet stock. We analyzed Baidu in the same depth we did Alibaba given the steep price fall, but had significant question marks and concerns as to the competitive landscape Baidu faces for its online advertising business. We concluded that Alibaba offered far better value regardless of its much higher starting multiples.
Year to date to end June, Baidu is down another 26%, while Alibaba is up 24%. We think our valuation assessment of these two names has already, and will continue to be fairly reflected. We were not able to justify investing in Baidu as a value stock using a DDM, we were able to justify Alibaba.
The Archetypal Value Stock – Gazprom
The above discussion on Alibaba is important in the context of this paper, but the reality is, as evidenced by the portfolio only having 6 stocks in the growth index (top 200), most stocks we own sit in the clear and obvious value camp. At the deep value end of the portfolio sits Gazprom. At the beginning of 2019, the company traded on a mere 2.9x PE, 0.3x PB and a dividend yield of 5.3%. For a long while, investors may have considered Gazprom something of a value trap. The advantage though of a stock that is so widely disliked by the market is that it takes very little for value to be realized. We have long been waiting for Gazprom to increase its dividends more substantially. This quarter, the catalyst for value creation that we were waiting for occurred, as they announced a greater than 60% increase in dividends year on year. The stock is now up 65% year to date and one of the portfolio’s best performers.
Alibaba and Gazprom are two ends of the spectrum when static metrics are isolated. We own both and believe both offer value in very different ways. Using a DDM allows us to consider a plethora of different types of companies and own them at the appropriate points in their lifecycle.
Avoiding the Value Traps
Possibly the greatest challenge for any value manager is identifying and avoiding the value traps. In excess of 25 years investing in emerging market equities has taught us that the value pool is littered with value traps. We believe our experience, but also a few key variables that we identify should help us steer clear of the pitfalls out there. There are macro variables and foreign exchange risks that of course feature, but it is not our intention to detail those here, given the bottom up focus of this paper.
The main concern as to why a company may trade at a discount is usually linked to potential structural or cyclical decline. In this era of rapid technological advancement, we spend a lot of time filtering out companies that we believe are most at risk from some form of disruption to their profitability. Additionally, we look at sustainable positive free cash flow generation, strong balance sheets, comparative advantage, barriers to entry and unique investment themes where possible.
Intangibles matter too. Poor governance is another feature of many companies exhibiting value attributes. We question how aligned management is with stakeholders and look to avoid state owned enterprises (SOEs) where appropriate. Linked to this, are broader ESG considerations and how deviation from good practice could harm shareholder returns.
Once again this highlights the risks and hazards of merely taking low multiples and building portfolios around these. As value managers we actively look for the low priced securities, but we are forward looking and hence must feel confident that the future prospects are robust such that value will be realized over time.
Concluding Remarks
Investing is all about interpretation. As Fund Managers we try to interpret which economies will deliver the most sustainable levels of economic growth. We try interpreting which companies will be the most successful in their field; and once we have established this, as value managers, we try to interpret which companies may be mispriced relative to those fundamentals and which offer the greatest margin of safety. At Mondrian we use a Dividend Discount Model to help us calculate, evaluate and interpret these various uncertainties. Other value managers will use different valuation tools or isolate different factors. In the majority of cases, investors will agree whether a stock is a clear value stock or not. However, given the range of definitions and degree of interpretation, this will not always be possible. As active investors looking to create alpha, we need and want that level of interpretation to be as broad as possible because that is what creates a market, but crucially, that is also how we achieve our competitive advantage.
Mondrian believes this interpretation is an art, and not a science. Mondrian also believes it has an excellent tool to isolate and determine value on a global basis. Used correctly, the DDM can allow us to invest in the deep value areas of our world such as Gazprom, and at certain points in the cycle, albeit rarely, even in more growth oriented areas such as Alibaba. Mondrian doesn’t look to replicate the value index, in fact we have highlighted why we believe this replication can create excessive exposure to certain areas of the asset class that are not necessarily in an investor’s best interest, whilst also amplifying volatility. It can also mean eliminating, or missing out on certain companies with sustainable growth prospects that are also mispriced.
Mondrian aims to outperform the value index, and of course the broader index over the long-term. The key to our success is not only the discipline with which we have adhered to our style, but also considering clear parameters to help us avoid the areas of structural decline, avoid poor governance and hence avoid the allure of value looking stocks that could be traps. We believe our DDM methodology works and has been dynamically applied since the company’s inception in 1990. From Graham & Dodd to Buffett, value investing like all investing is about interpretation, but for Mondrian, the use of a DDM is not open to interpretation.
Views expressed were current as of the date indicated, are subject to change, and may not reflect current views. Views should not be considered a recommendation to buy, hold or sell any security and should not be relied on as research or investment advice. The information was obtained from sources we believe to be reliable, but its accuracy is not guaranteed and it may be incomplete or condensed. All information is subject to change without notice.
This document may include forward-looking statements. All statements other than statements of historical facts are forward- looking statements (including words such as “believe,” “estimate,” “anticipate,” “may,” “will,” “should,” “expect”). Although we believe that the expectations reflected in such forward-looking statements are reasonable, we can give no assurance that such expectations will prove to be correct. Various factors could cause actual results or performance to differ materially from those reflected in such forward-looking statements. This document is an internal research paper. The material is for informational purposes only and is not an offer or solicitation with respect to any securities. Any offer of securities can only be made by written offering materials, which are available solely upon request, on an exclusively private basis and only to qualified financially sophisticated investors.
Past performance is not a guarantee of future results. An investment involves the risk of loss. The investment return and value of investments will fluctuate. There can be no assurance that the investment objectives of the strategy will be achieved. This document is solely owned by and the intellectual property of
Mondrian Investment Partners Limited. It may not be reproduced either in whole, or in part, without the written permission of Mondrian Investment Partners Limited.